Download
1 / 22
220 likes | 357 Vues
Using IMAGE Data for Space Weather. J. L. Green, S. F. Fung, R. Burley Goddard Space Flight Center J. L. Burch Southwest Research Institute W. W. L. Taylor Raytheon STX Corporation Space Weather Workshop NOAA Space Environment Center, Boulder, Colorado February 5-6, 1998. Abstract.

E N D
Using IMAGE Data for Space Weather J. L. Green, S. F. Fung, R. Burley Goddard Space Flight Center J. L. Burch Southwest Research Institute W. W. L. Taylor Raytheon STX Corporation Space Weather Workshop NOAA Space Environment Center, Boulder, Colorado February 5-6, 1998
Outline • Team, mission, and instruments • Data system and data products • Summary http://image.gsfc.nasa.gov/
IMAGE Team Members • Principal investigator: Dr. James L. Burch, SwRI • U.S. Co-Investigators: • Prof. K. C. Hsieh & Dr. B. R. Sandel, University of Arizona • Dr. J. L. Green & Dr. T. E. Moore, Goddard Space Flight Center • Dr. S. A. Fuselier, Lockheed Palo Alto Research Laboratory • Drs. S. B. Mende, University of California, Berkeley • Dr. D. L. Gallagher, Marshall Space Flight Center • Prof. D. C. Hamilton, University of Maryland • Prof. B. W. Reinisch, University of Massachusetts, Lowell • Dr. W. W. L. Taylor, Raytheon STX Corporation • Prof. P. H. Reiff, Rice University • Drs. D. T. Young, C. J. Pollack, Southwest Research Institute • Dr. D. J. McComas, Los Alamos National Laboratory • Dr. D. G. Mitchell, Applied Physic Labortory, JHU
IMAGE Foreign Co-Is • Foreign Co-Investigators • Dr. P. Wurz & Prof. P. Bochsler, University of Bern, Switzerland • Prof. J. S. Murphree, University of Calgary, Canada • Prof. T. Mukai, ISAS, Japan • Dr. M. Grande, Rutherford Appleton Laboratory, U.K. • Dr. C. Jamar, University of Liege, Belgium • Dr. J.-L. Bougeret, Observatoire de Paris, Meudon • Dr. H. Lauche, Max-Planck-Institut fur Aeronomie
Other Team Members • Participating Scientist: • Dr. G. R. Wilson, University of Alabama Huntsville • Drs. A. L. Broadfoot & C. C. Curtis, University of Arizona • Dr. J. D. Perez, Auburn University • L. Cogger, University of Calgary, Canada • Drs. R. F. Benson & S. F. Fung, Goddard Space Flight Center • Dr. W. Calvert, University of Massachusetts, Lowell • Drs. A. G. Ghielmetti, Y. T. Chiu, M. Schulz, & E. G. Shelley, Lockheed • Dr. J. M. Quinn, University of New Hampshire • Dr. J. Spann, Marshall Space Flight Center • Prof. J.-C. Gerard, University of Liege, Belgium • Dr. G. R. Gladstone, Southwest Research Institute • Dr. D. L. Carpenter, Stanford University
IMAGE Instruments • Neutral Atom Imagers • High Energy Neutral Atom (HENA) imagers • Medium Energy Neutral Atom (MENA) imagers • Low Energy Neutral Atom (LENA) imagers • FUV Imagers • Spectrographic Imager (SI) • Geocorona (GEO) imager • Wideband Imaging Camera (WIC) • EUV Imager • Extreme Ultra-Violet (EUV) imager • Radio Sounder • Radio Plasma Imager (RPI)
IMAGE Telemetry Modes • Store and forward telemetry mode • On-board storage and high rate dump through DSN twice/day (13 hour orbit) • SMOC receives Level-0 data and generates Level-1 (Browse Product) • SMOC being developed at Goddard Space Flight Center • Data products delivered to NSSDC for archiving and community distribution • Real-Time mode • IMAGE broadcasts all telementry data in a real-time mode • Data can be received by anyone • Not routinely use by NASA • Potential NOAA application • Receive real-time data • Generate “Space Weather” products • SMOC L0->L1 product generation software available for NOAA use
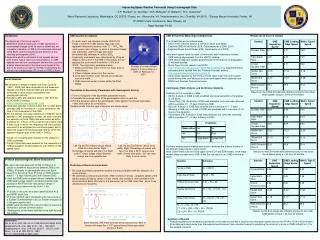
Simulated RPI Plasmagram • RPI browse product data will produce plasmagrams • Echoes shown in solid line, density features in dashed line. • Derived Quantities from Plasmagrams include: • Distance to Magnetopause, Plasmapause, Polar Cusp (when observed) • Magnetospheric shape (with model), structure, gross irregularities • Storm conditions from a plasma/radio wave perspective
Radio Plasma Imager (RPI) • RPI Observations • Remote sensing of electron density structure and magnetospheric boundary locations • Measure Requirements • Density range: 0.1-10**5 cm-3 (determine electron density from inner plasmasphere to magnetopause) • Spatial resolution: 500 km (resolve density structures at the magnetopause and plasmapause) • Storm/substorm Observations • Image Time: 3 minute (resolve changes in boundary locations) generating 480 plasmagrams/day • Quantity Simulated is an RPI “echo map” • Illustrates spatial location and intensity of return echoes (plotted as ray miss distance) • Doppler measurement (not shown) provides key information on boundary motion • Echoes from a large scale surface waves on the magnetopause
Spectrographic Imager (SI) • SI Observations • Far ultraviolet imaging of the aurora • Image full Earth from apogee • Measurement Requirement • FOV: 15°x 15° for aurora (image full Earth from apogee), • Spatial Resolution: 90 km • Spectral Resolution (top): Reject 130.4 nm and select 135.6 nm electron aurora emissions. • Spectral Resolution (bottom): 121.6 nm • Storm/substorm Observations • Image Time: 2 minutes generating 720 images/day • Derived Quantities • Structure and intensity of the electron aurora (top) • Structure
Geocorona (GEO) Imager • GEO Observations • Far ultraviolet imaging of the Earth’s Geocorona • Measurement Requirement • FOV: 1° x 360° for Geocorona • Spatial Resolution: 90 km • Spectral Resolution:Lyman alpha 121.6 nm • Storm/substorm Observations • Image Time: 2 minutes generating 720 images/day • Derived Quantities • Integrated line-of-sight density map of the Earth’s Geocorona • Not shown in the IMAGE Movie • Image at left from Rairden et al., 1986
Extreme Ultra-Violet (EUV) imager • EUV Observations • 30.4 nm imaging of plasmasphere He+ column densities • Measure Requirements • FOV: 90°x 90° (image plasmasphere from apogee) • Spatial Resolution: 0.1 Earth radius from apogee • Storm/substorm Observations • Image Time: 10 minutes generating 144 images/day • Derived Quantities: • Plasmaspheric density structure and plasmaspheric processes
Summary • IMAGE supports a full telemetry real-time down-link • IMAGE will provide potentially valuable space weather data • Level-1 and Browse data products in Common Data Format (CDF) • reuse of ISTP data display and analysis tools • Data processing software available for NOAA • Space weather products need more definition