Enhancing Space Weather Forecasts with Coronagraph Data Analysis
This study aims to improve Space Weather forecasts by analyzing CME asymmetry derived from coronagraph images. We evaluate whether these observations can accurately predict the occurrence and intensity of geomagnetic storms resulting from Coronal Mass Ejections (CMEs) and associated shocks hitting Earth. By comparing initial speed inputs from CME observations and metric Type II radio burst speeds, we assess their effectiveness in predicting IP shock arrival times. Results indicated statistical correlations between CME characteristics and geomagnetic activity, advancing forecasting accuracy.

Enhancing Space Weather Forecasts with Coronagraph Data Analysis
E N D
Presentation Transcript
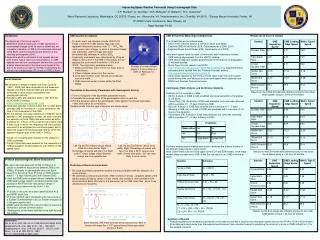
Improving Space Weather Forecasts Using Coronagraph Data S.P. Plunkett1, A. Vourlidas1, D.R. McMullin2, K. Battams3, R.C. Colaninno4 1Naval Research Laboratory, Washington, DC 20375, 2Praxis, Inc., Alexandria, VA, 3Interferometrics, Inc., Chantilly, VA 20151, 4George Mason University, Fairfax, VA 5th GOES Users’ Conference, New Orleans, LA Paper Number P1.50 • Introduction • The objectives of this study were to: • Determine whether measures of CME asymmetry in coronagraph images could be used to objectively aid forecasts of whether a CME or its associated shock will strike Earth, and the magnitude and duration of any resulting geomagnetic storm; • Determine whether estimated shock speeds derived from metric Type II radio burst observations, or CME speeds derived from coronagraph observations, provide a better measurement of the initial event speed at the Sun to be used as an input to models for predicting the arrival of an interplanetary (IP) shock or ICME at Earth. • CME Asymmetry Analysis • For each event, we selected a single LASCO/C3 image in which the CME leading edge was at an apparent heliocentric distance from 12 – 14 R. We used excess mass images, in which a pre-event image was subtracted, and the image data were photometrically calibrated in units of B/B. • Asymmetry parameters were determined by fitting an ellipse to the outline of the CME in this image, and by applying the cone model formulation of Xie et al (2003). The asymmetry parameters were: • Ellipse eccentricity (ratio of minor to major axes of fitted ellipse); • Offset of ellipse center from Sun center; • Cone apex position (solar latitude and longitude) and cone width; • CME mass and center of mass within the fitted ellipse. • CME Arrival Time Model Input Comparisons • The models that we considered were: • Shock Time of Arrival Version 2 (STOA-2, Moon et al 2002); • Empirical CME Arrival Model (ECA, Gopalswamy et al 2000, 2001); • Empirical Shock Arrival Model (ESA, Gopalswamy et al 2005). • Initial event speed inputs for each of the models were obtained as follows: • CME leading edge speeds from the LASCO catalog; • CME lateral expansion speeds perpendicular to the direction of propagation of the leading edge; • Metric Type II shock speeds from NGDC (http://www.ngdc.noaa.gov/stp/SOLAR/ftpsolarradio.html), supplemented by estimated shock speeds from the ‘Fearless Forecast’ archive (http://www.gi.alaska.edu/pipermail/gse_ff). • Other inputs required by the STOA-2 model (flare onset time and location, piston driving time, and background solar wind speed) were obtained from NGDC and Fearless Forecast archives. Results for 24-hour hit window Example of a user-defined ellipse fit to the outline of a CME on February 15, 2001. • Event Selection • We selected for analysis events from Solar Cycle 23 (1997 – 2005) that have observations and measured speeds of an Earth-directed CME and are isolated sufficiently to allow unique associations with geomagnetic activity. • Selected CMEs with apparent width ≥ 120 from the SOHO/LASCO catalog (http://cdaw.gsfc.nasa.gov/CME_List); • Restricted selection to those events with no other Earth-directed CME in a window of 2 days centered on the time of first observation of the CME; • For the analysis involving comparison of different inputs speeds to CME propagation models, we also restricted our selection to those CMEs that were observed within a window of 2 hours of the onset time of a metric Type II radio burst for which the frequency drift rate could be converted to an estimated coronal shock speed, and in which the location of the associated flare lay within the apparent angular span of the CME in LASCO. • A total of 101 events were selected for the analysis of CME asymmetry. • A total of 56 events were selected for the comparison of CME propagation model predictions with different initial speed inputs. • Contingency Table Analysis and Verification Statistics • Definition of 22 contingency table: • Hit (H): A shock or ICME is both predicted and observed within a ‘hit window’ of N hours; • Correct Null (CN): No shock or ICME was predicted, and none was observed within a window of 1 – 5 days following a CME; • Miss (M): A shock or ICME was detected within a window of 1 – 5 days following a CME, but no shock or ICME was predicted within a window of N hours of the detection; • False Alarm (FA): A shock or ICME was predicted, but none was observed, within a window of 1 – 5 days following a CME. • Correlation of Asymmetry Parameters with Geomagnetic Activity • Form a histogram of the asymmetry parameter values. • Calculate the average value of the geomagnetic index in each bin. • Plot the average value of the geomagnetic index against the binned asymmetry index, and search for correlations. • Sample results from this type of analysis are shown below. Results for the STOA-2 model with different proxies for the initial shock speed, using a 24 hour hit window Left: Kp and Dst indices versus ellipse offset from Sun center. Right: Percentage of events with Kp ≥ 5 or |Dst| ≥ 50 nT versus ellipse offset. Western events are more geoeffective. Left: Kp and Dst indices versus cone width. Right: Percentage of events with Kp ≥ 5 or |Dst| ≥ 50 nT versus cone width. Events with width > 50 are most likely to drive storms. Standard meteorological metrics were used to evaluate the relative success of the different speed inputs to each model. Note: Some metrics do not strictly apply to the ECA and ESA models, since these models always predict that a CME at the Sun will result in an ICME or shock at Earth. Results for the ESA model with different proxies for the initial shock speed, using a 24 hour hit window • IP Shock and Geomagnetic Storm Associations • We used a two-step approach similar to Zhang et al (2003) to determine associations between CMEs and ICMEs, IP shocks or geomagnetic storms at Earth: • Search for the arrival of an IP shock or ICME at Earth within 1 – 5 days following an Earth-directed CME; • Used the ICME plasma speed (where available) and the CME leading edge speed to constrain possible solar sources of the IP event by calculating a range of possible transit times from the Sun to 1 AU. • IP shocks in the solar wind were identified from ACE and WIND shock lists. • IP shocks at Earth were identified by the occurrence of a Sudden Commencement (SC) or Sudden Impulse (SI) in the geomagnetic field. • ICMEs were identified from a list provided by Cane and Richardson (private communication). • Geomagnetic storms were identified using both Kp and Dst indices. • Prediction of Shock Arrival at Earth • No single asymmetry parameter showed a strong correlation with the detection of a shock at Earth. • We identified a composite parameter (CME momentum [mass apparent speed of the leading edge] divided by center of mass offset), that showed a clear correlation with shock arrival at Earth. We refer to this parameter as the CME ‘mass flow’, since it has dimensions of mass/time. Results for the ECA model with different proxies for the initial CME speed, using a 24 hour hit window • Summary of Results • Forecast quality does not depend significantly on the data source that is used for the initial event speed input to the STOA-2, ESA or ECA models. • All models performed worse than the expected performance from a random forecast in predicting the arrival of a shock or ICME at Earth or L1 for this sample of events. References Xie, H. et al, JGR 109, doi:10.1029/2003JA010226, 2003. Gopalswamy, N. et al, GRL 27(2), 145 – 148, 2000. Gopalswamy, N. et al, JGR 106, 29,207 – 29,217, 2001. Moon, Y.-J. et al, GRL 29(10), 1390, doi:10.1029/2002GL014865, 2002. Earth-directed CME mass flow and shock associations. 93% of events with mass flux > 1012 grams/second have associated shocks at Earth.