Download
1 / 12
120 likes | 223 Vues
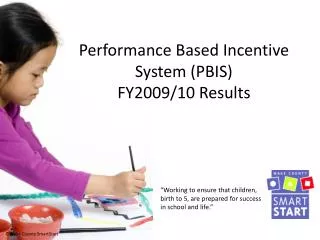
Performance Based Incentive System (PBIS) FY2009/10 Results. WCSS Results. WCSS met or exceeded all eight of the PBIS standards for which we have data, 5 at the high performing level and 3 at the minimum level.

E N D
WCSS Results • WCSS met or exceeded all eight of the PBIS standards for which we have data, 5 at the high performing level and 3 at the minimum level. • Most results increased or remained stable over last year, sustaining significant gains made in past six years: Example- Average star ratings and % in 4 and 5 star facilities.
Although Wake County has demonstrated growth in almost all standards, one of the most significant increases has been in early intervention B-2.
The only significant decrease this year was in Average Star Rating for children with special needs receiving subsidy, a trend not seen in other counties or statewide average.
The only standard that has decreased over time is EI 3-5, although still meeting minimumstandard.
Comparison Results • Generally, WCSS results are consistent with other large counties and state average. • Some standards are large county strengths and some are greater challenges for large counties. • Large counties do have significant influence on the state average. However, in some cases results are consistent with other large counties but not the state average. • Example- Lead Teacher Education high performing standard.
Lead Teacher Education-high performing standard- 7points (target 35%)
Comparison Results (cont.) • Lead Teacher Education is a relative strength in comparison to the state as well as other large counties and has consistently achieved at a higher level for the minimum standard (5 pts). • Wake County started off at a higher percentage than other counties (in FY06/07) and has continued to increase over the past 4 years. • Teacher education may be a strength because Wake county has a more highly education population than other counties.
Lead Teacher Education- minimum standard- 5 points (target 60%)
Additional Information NCPC re-examining PBIS: • May adjust standard target percentages since so many counties have exceeded them. • Have discontinued the existing family support (parent education and literacy) indicators. • Examining all areas to determine if other measures may be more appropriate.
Additional Information (cont.) • Missing PBIS data for teacher compensation remains an issue. Hope to have new workforce data this year. • Very positive three year trend for School Readiness indicators, using Kindergarten Initial Assessment. • Final Activity Report