Download
1 / 8
80 likes | 168 Vues
Explore spatial and temporal variability of Harmful Algal Blooms (HABs) compared to monitoring programs, with focus on Chl.a values. Discover lack of relationship between Chl.a levels and HAB abundance, providing suggestions for effective prevention.

E N D
Numerical Chl a criteria and HABs Margie Mulholland Old Dominion University
Problems • Same as before • Monitoring programs aren’t sampling HABs • Monitoring programs are unlikely to sample HABs • Spatial and temporal variability of HABs different from that of monitoring programs
Other sampling • CBP – cell counts > 10,000/ml • CBP – chl a > 20 mg/L • Stations where there are microscopic counts differ from where there are blooms • Ad hoc sampling VA CDC, Health Dept, Shellfish industry
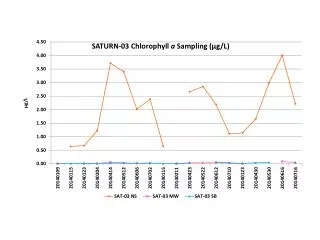
So far • No good relationship between Chl a and abundance of HAB taxa and harmful effects • Most often, same relative abundance or biomass at low versus high chl a • New from last time – bay-wide (no surprise) • Frequency analysis of chl a ranges versus dominant taxa • Even for tidal fresh (although more cyanos)
Where to start? • Frequency of chl a > 20 mg L-1 in mainstem
Developing chl a criteria • No set chl a numerical value will eliminate HABs • Instances of HABs at low chl a concentrations? And vice versa (what is a harmful effect?)
Suggestions • Reverse approach • High chl a is associated with HABs (range ~ 20-400 ug/L) • Set chl a standards to minimize likelihood of high chl a to prevent HABs • At the same time, use continuous monitoring to develop relationships between chl a and HABs, relate pigment indices to HABs for next step