Download

1 / 11
110 likes | 128 Vues
This study explores the relationship between MS lesion density and cortical thickness using connectivity analysis. The findings suggest that increased lesion density in white matter is associated with thinner cortex in connected grey matter.

E N D
Connectivity between MS lesion density and cortical thickness Keith Worsley Arnaud Charil Jason Lerch Department of Mathematics and Statistics, McConnell Brain Imaging Centre, Montreal Neurological Institute, McGill University
Connectivity • Measured by the correlation between data at pairs of voxels: Activation only Correlation only Voxel 2 + + Voxel 2 + + + + + + + Voxel 1 + Voxel 1 + +
Method 1: ‘Seed’ • Friston et al. (19??): Pick one voxel, then find all others that are correlated with it: • Problem: how to pick the ‘seed’ voxel?
Method 2: Iterated ‘seed’ • Problem: how to find the rest of the connectivity network? • Hampson et al., (2002): Find significant correlations, use them as new seeds, iterate.
Method 3: All correlations • Problem: how to find isolated parts of the connectivity network? • Cao & Worsley (1998): find all correlations (!)
Practical details • Find threshold first, using random field theory • Keep only correlations > threshold • Then keep only local maxima i.e. cor(voxel1, voxel2) > cor(voxel1, neighbours of voxel2), > cor(neighbours of voxel1, voxel2),
MS lesions and cortical thickness(Arnaud et al., 2004) • N = 425 mild MS patients • Lesion density, smoothed 10mm • Cortical thickness, smoothed 20mm • Hypothesis: increased lesion density in white matter -> thinner cortex in connected grey matter • Find connectivity i.e. find voxels in 3D, nodes in 2D with high cor(lesion density, cortical thickness)
n=425 subjects, correlation = -0.56826 5.5 5 4.5 4 Average cortical thickness 3.5 3 2.5 2 1.5 0 10 20 30 40 50 60 70 80 Average lesion volume
threshold threshold threshold threshold
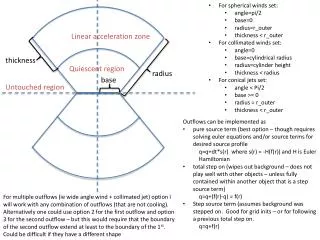
What would be really nice: • Use DTI fibre tracking data to get a measure of probability of connection between each point in WM and each point on the cortical surface • Huge fibre tracking problem: • Seeds at every voxel! • Repeat over subjects? • How to combine subjects? • Plot correlation vs. probability of connection - should be a positive relationship …