Download

1 / 57
580 likes | 719 Vues
Introduction to DNA Microarrays. Michael F. Miles, M.D., Ph.D. Depts. of Pharmacology/Toxicology and Neurology and the Center for Study of Biological Complexity mfmiles@vcu.edu 225-4054. Biological Regulation: “You are what you express”. Levels of regulation Methods of measurement

E N D
Introduction to DNA Microarrays Michael F. Miles, M.D., Ph.D. Depts. of Pharmacology/Toxicology and Neurology and the Center for Study of Biological Complexity mfmiles@vcu.edu 225-4054
Biological Regulation: “You are what you express” • Levels of regulation • Methods of measurement • Concept of genomics
Regulation of Gene Expression • Transcriptional • Altered DNA binding protein complex abundance or function • Post-transcriptional • mRNA stability • mRNA processing (alternative splicing) • Translational • RNA trafficking • RNA binding proteins • Post-translational • Many forms!
Regulation of Gene Expression • Genes are expressed when they are transcribed into RNA • Amount of mRNA indicates gene activity • Some genes expressed in all tissues -- but are still regulated! • Some genes expressed selectively depending on tissue, disease, environment • Dynamic regulation of gene expression allows long term responses to environment
Mesolimbic dopamine ? Other Reinforcement Intoxication Acute Drug Use Chronic Drug Use ?Synaptic Remodeling Persistent Gene Exp. “Addiction” Compulsive Drug Use Altered Signaling Gene Expression Tolerance Dependence Sensitization ?Synaptic Remodeling
Progress in Studies on Gene Regulation 1960 1970 1980 1990 2000 mRNA, tRNA discovered Nucleic acid hybridization, protein/RNA electrophoresis Molecular cloning; Southern, Northern & Western blots; 2-D gels Subtractive Hybridization, PCR, Differential Display, MALDI/TOF MS Genome Sequencing DNA/Protein Microarrays
Nucleic Acid Hybridization: How It Works
Primer on Nucleic Acid Hybridization • Hybridization rate depends on time,the concentration of nucleic acids, and the reassociation constant for the nucleic acid: C/Co = 1/(1+kCot)
A Bit of History ~1992-1996: Oligo arrays developed by Fodor, Stryer, Lockhart, others at Stanford/Affymetrix and Southern in Great Britain ~1994-1995: cDNA arrays usually attributed to Pat Brown and Dari Shalon at Stanford who first used a robot to print the arrays. In 1994, Shalon started Synteni which was bought by Incyte in 1998. However, in 1982 Augenlicht and Korbin proposed a DNA array (Cancer Research) and in 1984 they made a 4000 element array to interrogate human cancer cells. (Rejected by Science, Nature and the NIH)
Candidate Gene Studies Bioinformatics: Genetical genomics Functional Grouping Literature Networks Protein Interactions Promotor Motif Grouping Molecular Triangulation: Genomics, Genetics and Pharmacology Expression Profiling: A Non-biased, Genomic Approach to Understanding Complex CNS Disease
Utility of Expression Profiling • Non-biased, genome-wide • Hypothesis generating • Gene hunting • Pattern identification: • Insight into gene function • Molecular classification • Phenotypic mechanisms
-2 0 +2 relative change AvgDiff S-score Use of S-score in Hierarchical Clustering of Brain Regional Expression Patterns NAC NAC VTA PFC VTA PFC HIP HIP
Synthesis and Analysis of 2-color Spotted cDNA Arrays: “Brown Chips”
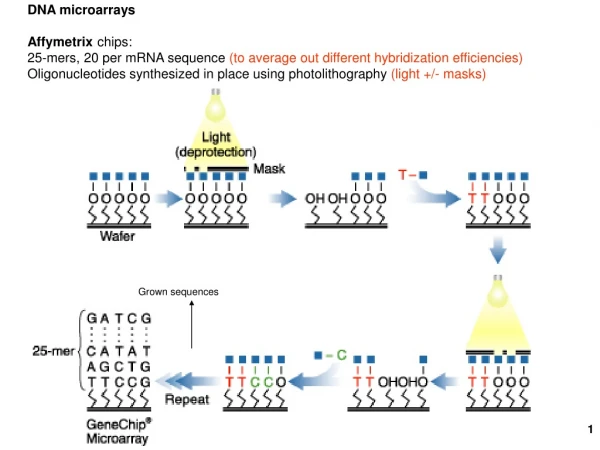
Synthesis of High Density Oligonucleotide Arrays by Photolithography/Photochemistry
GeneChip Features • Parallel analysis of >30K human, rat or mouse genes/EST clusters with 15-20 oligos (25 mer) per gene/EST • entire genome analysis (human, yeast, mouse) • 3-4 orders of magnitude dynamic range (1-10,000 copies/cell) • quantitative for changes >25% ?? • SNP analysis
Rtase/ Pol II Total RNA dsDNA Biotin-cRNA T7 pol AAAA-T7 TTTT-5’ TTTT-T7 5’ AAAA CTP-biotin Hybridization Oligo(dT)-T7 Scanning Steptavidin- phycoerythrin PM MM Oligonucleotide Array Analysis
Stepwise Analysis of Microarray Data • Low-level analysis -- image analysis, expression quantitation • Primary analysis -- is there a change in expression? • Secondary analysis -- what genes show correlated patterns of expression? (supervised vs. unsupervised) • Tertiary analysis -- is there a phenotypic “trace” for a given expression pattern?
Affymetrix Arrays: Image Analysis “.DAT” file “.CEL” file
Affymetrix Arrays: PM-MM Difference Calculation Probe pairs control for non-specific hybridization of oligonucleotides
Variability in Ln(FC) Ln(FC1) (a) Ln(FC2)
Probe Level Analysis Methods • AvgDiff -- Affymetrix 1996, trimmed mean with exclusion of outliers, PM-MM • MAS 5 -- Affymetrix 2001, modeled correction of MM, Tukey’s bi-weight, PM-MM or PM-m • MBEI -- Li and Wong 2001, modeled correction and outlier detection, PM-MM or PM only • RMA (Robust Multichip Analysis) -- Irizarry et al. 2002, PM only • PDNN (Position Dependent Nearest Neighbor) - Zhang et al. 2003, thermodynamic model for probe interactions, PM only
http://www.ipam.ucla.edu/publications/fg2000/fgt_tspeed9.pdf Slide Normalization: Pieces and Pins “Lowess” normalization, Pin-specific Profiles After Print-tip Normalization See also: Schuchhardt, J. et al., NAR 28: e47 (2000)
Statistical Analysis of Microarrays: “Not Your Father’s Oldsmobile”
Secondary Analysis: Expression Patterns • Supervised multivariate analyses • Support vector machines • Non-supervised clustering methods • Hierarchical • K-means • SOM
Clustering Methods • Distance measurement -- Euclidean most frequently used (d2 = S (xi-yi)2) • Clustering techniques • Supervised multivariate analyses • Support vector machines • Non-supervised clustering methods • Hierarchical -- single vs. complete vs. average linkage • K-means -- have to estimate “k” initially • SOM -- self-organizing maps • Principal components analysis
K-means vs. Hierarchical Clustering • K-means: select number of groups, divide genes randomly into those groups, calculate inter- and intra-group distances. Move genes until maximize inter-group and minimize intra-group differences. • Hierarchical: calculate all pairwise distances (correlations) and order genes accordingly.
-2 0 +2 relative change AvgDiff S-score Use of S-score in Hierarchical Clustering of Brain Regional Expression Patterns NAC NAC VTA PFC VTA PFC HIP HIP
Expression Profiling: “It is possible that the expression profile could serve as a universal phenotype … Using a comprehensive database of reference profiles, the pathway(s) perturbed by an uncharacterized mutation would be ascertained by simply asking which expression patterns in the database its profile most strongly resembles … it should be equally effective at determining consequences of pharmaceutical treatments and disease states” Hughes et al. Cell 102:109-126 (2000)
Use of Expression Profile “Compendium” to Characterize Gene or Drug Function Key features: established error model profiled large number of mutants/drugs under highly controlled conditions statistical treatment of expression patterns verified array results with biochemical/phenotypic assays Hughes et al. Cell 102:109-126 (2000)
Correlation in Expression Profiles of Drugs/Genes Affecting Same Pathways cup5 and vma8, components of H+/ATPase complex Unrelated gene mutants HMG CoA-reductase mutant vs. lovastatin, an inhibitor of HMG2 Red symbols = significant change (p<0.05) in both treatments Hughes et al. Cell 102:109-126 (2000)
Assigning Function to Uncharacterized Genes by Expression Profiles Hughes et al. Cell 102:109-126 (2000)
Tertiary Analysis: Connecting Function with Expression Patterns • Annotation • UniGene/Swiss-Prot, SOURCE, DAVID • Biased functional assessment • Manual, GenMAPP, GeneSpring • Non-biased functional queries • PubGen • MAPPFinder, DAVID/Ease, GEPAS, GOTree Machine, others • Overlaying genomics and genetics • WebQTL