Download
1 / 41
410 likes | 447 Vues
Explore the world of DNA expression. Learn how genes are transcribed into mRNA and how cells determine which proteins to produce. Discover techniques like SAGE for large-scale studies.

E N D
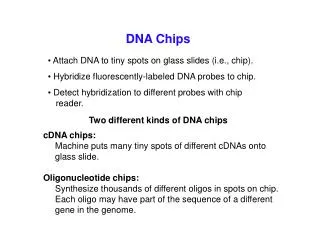
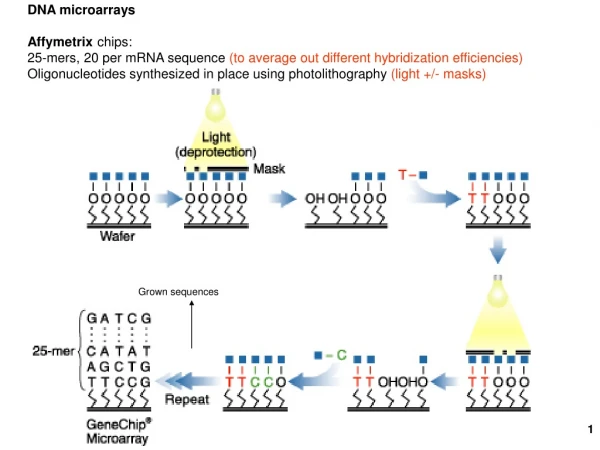
DNA microarrays Affymetrix chips: 25-mers, 20 per mRNA sequence (to average out different hybridization efficiencies) Oligonucleotides synthesized in place using photolithography (light +/- masks) Grown sequences
Nimblegen: addressable micro-mirrors to deprotect small spots of growing DNA Typical size: 60-mers Typical length = 60 nts
Resolution: 60 nt probes 30 nt overlapping windows Tiling arrays
A type IIs restriction enzyme cuts outside its recognition sequences 10 BsmFI GGGACNNNNNNNNNN / NNNNNNNCCCTGNNNNNNNNNNNNNN / NNNN 14
What Exactly is DNA Expression? DNA expression refers to the study of how specific genes are transcribed at a given point in time in a given cell. A gene is transcribed into a messenger RNA (mRNA) transcript when the protein that is encoded by the gene is required by the cell. This occurs because DNA located in the nucleus, but all of the machinery necessary for translation, or producing proteins, resides in the cytoplasm. The cell resolves this problem by creating a copy of the gene (mRNA) that is capable of entering the cytoplasm through the nuclear pores. By examining which transcripts are present in a cell, it is possible to deduce which genes (and their related proteins) are expressed in a cell type, and at what time these are expressed. In the past, DNA expression studies typically looked at only a few transcripts at any one time, due to the limitations of the techniques available1. But in recent years several new techniques have been developed that enable large scale studies of DNA expression; these can be used to create 'expression profiles'. An expression profile is a characterization of the relative quantity of every transcript that is produced in any one cell type. One technique that has been used to generate expression profiles is SAGE (Serial Analysis of Gene Expression). What is SAGE (Apart from a Spice) SAGE is a technique that allows rapid, detailed analysis of thousands of transcripts in a cell. The basic concept of SAGE rests on two principles: firstly, a small sequence of nucleotides from the transcript, called a 'tag', can effectively identify the original transcript from whence it came, and secondly, that linking these tags allows for rapid sequencing analysis of multiple transcripts. Imagine having thousands of transcripts to sequence - each sequencing event would take a certain amount of time to complete, and several thousand of these events would be necessary to identify each individual transcript. By linking the tags together, only one sequencing event is required to sequence every transcript within the cell, making the task of DNA expression profiling a much less daunting one1,2. Five Easy Steps and You Too Can Do SAGE Figure 2 shows a schematic diagram of each of the steps in SAGE. First, a complimentary DNA strand, or cDNA, of each transcript in the cell must be generated. This is necessary, since mRNA is much less stable than DNA. The mRNA of eukaryotes is polyadenylated, meaning a poly(A) tail is added to the 3' end of the final transcript. Therefore, a primer consisting of multiple 'T's can be made that will complimentary base pair with the poly(A) tail of every mRNAs in a cell. Once the primer has bound to the mRNA, the enzyme reverse transcriptase can make a DNA strand that is complimentary to the RNA. This DNA strand will then be converted to a double-stranded DNA molecule, which can then proceed to the next step. SAGE (serial analysisof gene expression) =NlaIII 10 bases downstream on the top strand Painless Gene Expression Profiling:SAGE (Serial Analysis of Gene Expression) Chan Ho Song & Michelle WyseGraphics: Jiang Long With the advent of the human genome project, a vast amount of information about genes and gene structure is suddenly at our fingertips. But this information is limited. Every cell within an organism has the same genetic composition (with the exception of its gametes), and yet, obviously skin tissue is very different from nervous tissue. The DNA sequence cannot provide information about these differences, which represent the next level of complexity and organization within an organism: DNA expression. Cells within a multicellular organism, such as ourselves, specialize to perform specific functions to increase the efficiency of the organism. Nerve cells, or neurons, express neuron-specific proteins that allow it to perform neuron duties. Skin, or epithelial cells, have their own specific proteins that enable their protective functioning. Both neuron and epithelial cell have the genes encoding for neural- and epithelial-specific proteins, but each cell only expresses the genes that it requires, and not other tissue-specific genes (Figure 1). In this way, a given DNA sequence only provides information about what could be, not what actually is. Figure 1. Differential gene expression is responsible for the morphology of different cells. All cells within an organism have the same DNA, but not all genes are expressed. An epithelial cell will express only genes specific to skin, whereas a neuron will express genes necessary for its development.
What Exactly is DNA Expression? DNA expression refers to the study of how specific genes are transcribed at a given point in time in a given cell. A gene is transcribed into a messenger RNA (mRNA) transcript when the protein that is encoded by the gene is required by the cell. This occurs because DNA located in the nucleus, but all of the machinery necessary for translation, or producing proteins, resides in the cytoplasm. The cell resolves this problem by creating a copy of the gene (mRNA) that is capable of entering the cytoplasm through the nuclear pores. By examining which transcripts are present in a cell, it is possible to deduce which genes (and their related proteins) are expressed in a cell type, and at what time these are expressed. In the past, DNA expression studies typically looked at only a few transcripts at any one time, due to the limitations of the techniques available1. But in recent years several new techniques have been developed that enable large scale studies of DNA expression; these can be used to create 'expression profiles'. An expression profile is a characterization of the relative quantity of every transcript that is produced in any one cell type. One technique that has been used to generate expression profiles is SAGE (Serial Analysis of Gene Expression). What is SAGE (Apart from a Spice) SAGE is a technique that allows rapid, detailed analysis of thousands of transcripts in a cell. The basic concept of SAGE rests on two principles: firstly, a small sequence of nucleotides from the transcript, called a 'tag', can effectively identify the original transcript from whence it came, and secondly, that linking these tags allows for rapid sequencing analysis of multiple transcripts. Imagine having thousands of transcripts to sequence - each sequencing event would take a certain amount of time to complete, and several thousand of these events would be necessary to identify each individual transcript. By linking the tags together, only one sequencing event is required to sequence every transcript within the cell, making the task of DNA expression profiling a much less daunting one1,2. Five Easy Steps and You Too Can Do SAGE Figure 2 shows a schematic diagram of each of the steps in SAGE. First, a complimentary DNA strand, or cDNA, of each transcript in the cell must be generated. This is necessary, since mRNA is much less stable than DNA. The mRNA of eukaryotes is polyadenylated, meaning a poly(A) tail is added to the 3' end of the final transcript. Therefore, a primer consisting of multiple 'T's can be made that will complimentary base pair with the poly(A) tail of every mRNAs in a cell. Once the primer has bound to the mRNA, the enzyme reverse transcriptase can make a DNA strand that is complimentary to the RNA. This DNA strand will then be converted to a double-stranded DNA molecule, which can then proceed to the next step. Painless Gene Expression Profiling:SAGE (Serial Analysis of Gene Expression) Chan Ho Song & Michelle WyseGraphics: Jiang Long With the advent of the human genome project, a vast amount of information about genes and gene structure is suddenly at our fingertips. But this information is limited. Every cell within an organism has the same genetic composition (with the exception of its gametes), and yet, obviously skin tissue is very different from nervous tissue. The DNA sequence cannot provide information about these differences, which represent the next level of complexity and organization within an organism: DNA expression. Cells within a multicellular organism, such as ourselves, specialize to perform specific functions to increase the efficiency of the organism. Nerve cells, or neurons, express neuron-specific proteins that allow it to perform neuron duties. Skin, or epithelial cells, have their own specific proteins that enable their protective functioning. Both neuron and epithelial cell have the genes encoding for neural- and epithelial-specific proteins, but each cell only expresses the genes that it requires, and not other tissue-specific genes (Figure 1). In this way, a given DNA sequence only provides information about what could be, not what actually is. Figure 1. Differential gene expression is responsible for the morphology of different cells. All cells within an organism have the same DNA, but not all genes are expressed. An epithelial cell will express only genes specific to skin, whereas a neuron will express genes necessary for its development.
ChIP-chip: for protein – DNA interactions Isolate chromatin Formaldehyde (HCHO) crosslinks amino groups on proteins to functional groups on DNA bases No-antibody background Ab to the protein of interest Using protein A beads Gives total DNA signal for comparison Formaldehyde crosslinks can be reversed by heat, pH, or high salt Cy5 and Cy3 are fluorescent labeling compounds of different color via linker ligation (ligate a constant DS sequence to all fragments and then do PCR) or random priming (using random hexamers, say)
ChIP-chip for protein binding sites on DNA in vivo Protein of interest Formadehyde (HCHO) Cross-linked chromatin Isolate nucleiFragment by sonication Add antibody, no antibody = control Immunoprecipitate Reverse crosslinks (65o) via linker ligation (ligate a constant DS sequence to all fragments and then do PCR) or random priming (using random hexamers, say) PCR amplify and label: Cy5Cy3 Hybridize to microarray Adapted from http://www.abcam.com/index.html?pageconfig=resource&rid=10738&pid=5 Measure red/green = enrichment by antibody
1. 454 sequencing Amplify single DNA molecules on single beads Sequence each DNA/bead by stepwise Incorporation of A, G,C or T in mini-wells
bead Aqueous microsphere
BEAMing: PCR on beads compartmentalized in a water-oil emulsion. Millions of primers attached to each bead, Producing millions of copies of bead-attached Templates from one original template molecule Anneal primer for sequencing and load DNA polymerase and SSB after enriching For template-loaded beads
Attached oligomers were pre-labeld red or green, then mixed and emulsified. See single beads in aqueous microspheres in oil.
BEAMing = beads, amplification, emulsion, magnetics = cloning DNA molecules via PCR on beads No template or bead Aqueous microspheres Had one template Had another template No template No bead Remove oil
Big beads- Template, primer, DNA polymerase Small beads- ATP sulfurylase, Luciferase Solution- One dNTP Luciferin, APS
Destroy old nucleoside triphosphate substrate before adding new one APS = adenosine phosphosulfate
2. Solexa/Illumina sequencing Intelligent Bio-Systems (Jue, Turro… Columbia) Amplification in situ on glass surface of flow cell (PCR that keeps different DNAs separate- “micro-cloning” Sequencing with reversible fluorescent terminator dNTPs (one nucleotide at a time)
3. Applied Biosystems SOLiD sequencing Shendure, Church et al. Webinar: http://appliedbiosystems.cnpg.com/lsca/webinar/rhodes/chemistry/20070618/ Shendure, J., Porreca, G.J., Reppas, N.B., Lin, X., McCutcheon, J.P., Rosenbaum, A.M., Wang, M.D., Zhang, K., Mitra, R.D., and Church, G.M. 2005. Accurate multiplex polony sequencing of an evolved bacterial genome. Science 309: 1728-1732. Polony (polymerase colony) by emulsion PCR or similar on beads (BEAMing) Attach beads to glass slide for sequencing Sequence by ligation!
AA CC GG TT AT TA CG GC
5 primer rounds In total