Plant Canopy Analysis
Plant Canopy Analysis. Gaylon S. Campbell, Ph.D. Decagon Devices and Washington State University. Radiant energy and plant canopy analysis. Why do we care about the radiation environment of plant canopies? Calculate Leaf Area Index (LAI) Crop growth stage Ecosystem health

Plant Canopy Analysis
E N D
Presentation Transcript
Plant Canopy Analysis Gaylon S. Campbell, Ph.D. Decagon Devices and Washington State University
Radiant energy and plant canopy analysis • Why do we care about the radiation environment of plant canopies? • Calculate Leaf Area Index (LAI) • Crop growth stage • Ecosystem health • Radiation use efficiency
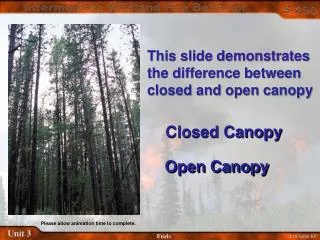
Radiant energy and plant canopy analysis • Must have detailed knowledge of light environment to use photosynthesis models • Partitioning ET into E and T • Need to know fraction of energy intercepted by canopy and fraction transmitted to soil
Intercepted PAR and Biomass Production • Cumulative intercepted photosynthetically active radiation (PAR) linearly related to total biomass production
Tools for detailed analysis • Radiation budget & view factors • Fisheye analysis • Plant canopy light environment • Fisheye analysis • Ceptometer – measures light interCEPTed by canopy
Definitions • Zenith angle (Ψ) – angle between sun and the zenith (vertical) • Transmission coefficient (τ) – fraction of sunlight transmitted through canopy to ground • Direct beam radiation – sunlight coming directly from sun (leaves a shadow) • Diffuse radiation – sunlight that has been scattered Ψ
Plant canopy light environment -leaf area index (LAI) • Leaf Area Index (LAI) – One-sided surface area of leaves/surface area of soil • Unit area basis: m2 m-2 • How do we measure • Destructive sampling • Light attenuation • Ceptometer • Fisheye photograph
LAI – destructive sampling • Harvest leaves from 1 m2 canopyarea • Physically measure surface area with optical meter • Advantages: direct measurement • Disadvantages: destructive, time consuming, wilting
LAI-light attenuation theory Leaf with area = a Unit ground Area a a A a • t is transmission and n is the number of leaves • This is only true if all of the leaves are horizontal LAI
Real canopies (leaves aren’t all horizontal) • Leaf angle distribution parameter (χ) • Describes the orientation of the leaves spherical canopy χ= 1 (most canopies) vertical canopy χ= 0 (onions < 1) horizontal canopy χ= ∞ (strawberries χ= 3)
Extinction coefficient • We can use the leaf angle distribution to determine an extinction coefficient (G) at a particular zenith angle What does G do for us? - allows us to relate τto LAI for any canopy, given c
What parameters do we need to calculate LAI? • Zenith angle (ψ) • Time and location • latitude and longitude • Canopy extinction coefficient (G) • Calculate from leaf angle distribution (χ) = 1 for most canopies • Canopy transmission coefficient (τ) • Estimate from fisheye image • Use ceptometer to measure directly
LAI from Ceptometers • Measure above-canopy radiation • Measure below-canopy radiation • Meter calculates τ
LAI from Ceptometer • What else does a meter need to calculate LAI? • Time and location (zenith angle) • Estimate of leaf angle distribution parameter (χ) • Note: LAI measurements are best without beam radiation (only diffuse radiation) • broken clouds are worst (changing radiation conditions) Decagon Accupar LP-80 LI-COR LAI-2000
What is a fisheye analysis? • Simply a projection of a hemisphere onto a plane • In our case, a picture is taken through a special lens that projects a full 180 degree hemisphere onto the film
What does this image allow us to do? • Determine view factors of surrounding objects • View factor determines radiative influence of one object on another • Determine light transmission coefficients through a canopy – diffuse and direct
What does this image allow us to do? • Determine when a particular location will be in direct sunlight • Determine what percentage of time a location will be sunlit • Determine τ, LAI, and χ values
Determining view factors • Simplest analysis • Aobject is the area of the picture taken up by the object of interest • Atotalis the total area of the photograph
Determining transmission coefficients • Project the fisheye picture onto a grid
30 330 60 300 90 E 270 W 240 120 150 210 180 S
Determining transmission coefficients • Visually estimate the fraction of sky visible in each grid sector (1 = full sky) • Average the value for each zenith angle band = τψ
t ~ 0.05 30 t ~ 0.7 330 60 300 90 E 270 W 240 120 t = 1.00 150 210 180 S
Calculating average understory radiant fluxes • τd is the transmission coefficient for diffuse radiation • But, if we average over a day or longer, it approximates the total radiation transmission coefficient so: Φbc = average radiant flux density below canopy ST avg = average total radiation above canopy
Calculating times and duration of direct beam • Plot sun path on grid • Segment into time steps (hours) N E W S
LAI from fisheye photo • First method • G58 = 0.5 for all leaf angle distributions! • Determine τ at ψ = 58° from fisheye photo
LAI from fisheye photo(method 2: use solver in excel) • Determine τ at ψ=15, 45, and 75° from fisheye photo • Calculate G at each zenith angle with an arbitrary value of χ • Calculate new values of τ for each zenith angle using G from step 2 and an arbitrary LAI value • Calculate sum of squared errors between τfisheye and τarbitrary • Use solver to minimize SSE by adjusting arbitrary LAI and χ values • Results in decent estimate for both LAI and χ!
LAI from fisheye photo(method 3: use software package) • HemiView software (ΔT Devices) • Import digitized fisheye photo • Software does all of the functions that we talked about doing manually • τ, LAI, χ