Download
1 / 16
160 likes | 185 Vues
This paper presents a knowledge-assisted visualization approach for turbulent combustion simulations, focusing on observing variable relationships close to the mixfrac surface and bringing out the lower values of other variables. Challenges include unknown data ranges and lack of control over information shown around the surface. Our solution involves transfer function specification and visualization-specific compression. Future work includes time-varying, multivariate data compression and utilizing domain knowledge. Video demos and extra slides on visualization-specific compression are provided.

E N D
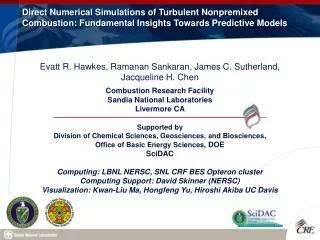
Knowledge-Assisted Visualization of Turbulent Combustion Simulations Chaoli Wang, Hongfeng Yu, Kwan-Liu Ma
Turbulent combustion simulations • Direct numerical simulations • Time-varying, multivariate data • 800 * 686 * 217, 450MB • 53 time steps • 4 variables: mixfrac, chi, HO2, and OH • 93GB in total
Visualization-specific task • Scientific interests • Observe variable relationships close to the mixfrac surface • Bring out more the lower values of other variables The mixed rendering of the mixfrac (isovalue = 0.2) and the HO2 variables
Challenges • Data ranges of other variables close to the surface are unknown • Only value-based transfer function may bring out undesired visualization contents • Lack of control over the amount of information shown around the surface
d = 0.02 Visualization result d = 0.05
d = 0.10 Visualization result d = 0.20
Summary • Knowledge-assisted visualization • Domain knowledge: isovalue, ranges of interests • Derived knowledge: distance volume and partial histogram • Importance-driven visualization • Future work • Time-varying, multivariate data compression • Utilize domain knowledge • Visualization-specific compression
Visualization-specific compression • Regions of interest are around the given surface • Data precision can thus vary according to the distance to the surface • Our solution • Non-uniform quantization • Space-time coherence utilization • Decompression on the fly using graphics hardware
Compression result • Compression ratio: ~20x • Each voxel only uses less than 2 bits per variable on the average • Advantages • Reduce data transfer among disk to main memory, and main memory to video memory • Fast offline compression and online decompression • Preserve fine details near the surface and maintain the overall image quality
Compression result original compressed (~20x)
Compression result original compressed (~20x)