Download
1 / 46
460 likes | 612 Vues
Critical Issues in Transportation 2011 “The Future Ain’t What it Use to Be”. February 17, 2011. The UVM Transportation Research Center (TRC) is a hub for: Innovative and interdisciplinary research Education and outreach on sustainable transportation system solutions.

E N D
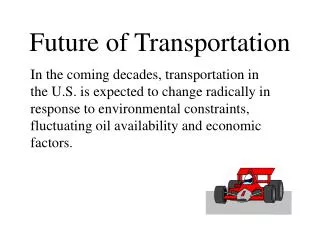
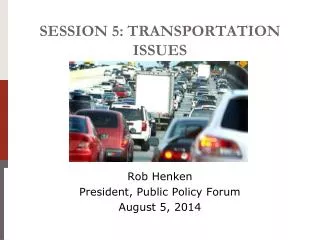
Critical Issues in Transportation 2011 “The Future Ain’t What it Use to Be” February 17, 2011
The UVM Transportation Research Center (TRC) is a hub for: • Innovative and interdisciplinary research • Education and outreach on sustainable transportation system solutions. • Since our founding in 2006, the TRC has: • attracted over $3.5 million to UVM in new external grants; • funded 67 graduate students with $28K stipends; • hosted over 3,200 people at its events; • created seven new courses.
Four Key Factors Shaping our Future • Demographics • Energy Costs • Climate Change • Funding
Which Sector uses the most Energy in the United States? • Residential • Commercial • Industrial • Transportation
U.S. Oil Use By Sector Electricity1% Residential7% Industrial23% Transportation69% Source: Energy Information Administration, Annual Energy Outlook 2005Data are for 2005
U.S. Motorization: Cars per 1,000 People Source: David Jones, Mass Motorization and Mass Transit, 2008.
Driving Kids to School Increases Source: National Household Travel Survey, 2009. http://nhts.ornl.gov/
Trends In Personal Mobility • 75% of trips taken by car are less than 1 mile • People who walk to work dropped by 26% between 1990 and 2000. • The average American driver spends 443 hours per year, or 55 8-hour working days behind the wheel • Only 1 American in 200 rides a bicycle to work.
DEMOGRAPHICS Source: NIH
Which State has the highest median age: • Florida • Maine • Vermont • New Hampshire
Demographics Data Set: 2007 Population Estimates
Demographics • 2000-2006: New England’s population up 347,000 • Increase 407,000 in minority population • Decrease of 60,000 in white population • Gain of 2.5 % is less than half that of the nation as a whole. Carsey Institute – UNH 2008
Why should transportation professionals care about public health?
Demographics Obesity and public health concerns
Demographics Obesity and public health concerns
How much does obesity cost our three states annually? • $300 million • $500 million • $750 million • $1 billion
Climate Change • Transportation is the fastest growing source of greenhouse gases in the United States, accounting for 28% of total greenhouse gas emissions in 2006. • Transportation is also the largest end-use source of carbon dioxide (CO2)—the most prevalent greenhouse gas. • 28% of the energy we use in the US goes to transporting people and goods from one place to another.
How is climate change affecting our transportation system? A. Increased freeze thaw cycle reduces structural life expectancy B. Increased temperatures leads to pavement and rail buckling C. Increased rainfall/intensity leads to more flooding and associated bridge, culvert and roadway washouts D. Increased wind force increase scour impact on bridges E. All of the above and more
Climate Change US GHG Emissions by Sector Figure credit: Davies, J. and C. Facanha.
8,420,589 lane miles • 46,630 miles of interstate • 3,014,116 million vehicle miles traveled (VMT) • 599 million train miles traveled • 599,766 road bridges • 5,202 public use airports • 360 commercial sea and river ports • 7,700 public transit agencies • 53,353 million passenger miles on public transit • 29,627 miles of inland waterways
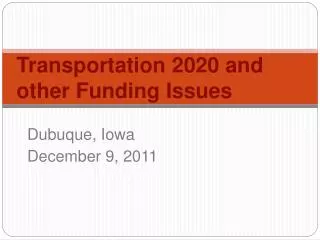
In 2006, federal, state and local expenditures on transportation totaled $199.4 billion, including: • $99.8 billion Highway • $44.1 billion Transit • $1.5 billion Rail • $41.2 billion Air • $10.9 billion Water • $91 million Pipeline • ARRA added an additional $48 billion in transportation spending
Should we raise revenue to maintain our current infrastructure? A. YesB. No
Increased Electrical Need to Electrify Current Fleet with Current Travel Behavior
“The Future Ain’t What it Use to Be” Burning the last street car in downtown Burlington, Main St. Aug 4, 1929, Courtesy of Special Collections, Bailey Howe Library