Quantify Uncertainty in Travel Forecasts
320 likes | 337 Vues
Learn the benefits and methods of quantifying uncertainty in travel forecasts, including response surface simulation and Monte Carlo simulation. Explore case studies from Toledo and Chattanooga to understand the impact of uncertainties on key parameters.

Quantify Uncertainty in Travel Forecasts
E N D
Presentation Transcript
Quantify Uncertainty in Travel Forecasts May, 2017 Jason Chen, RSG Vince Bernardin, RSG Thomas Adler, RSG Nikhil Sikka, RSG Steven Trevino, RSG Steve Tuttle, RSG
Acknowledgement & Disclaimer This project was funded as part of the TMIP Toolbox Disclaimer The views and opinions expressed in this presentation are those of the presenters and do not represent the official policy or position of FHWA and do not constitute an endorsement, recommendation, or specification by FHWA.
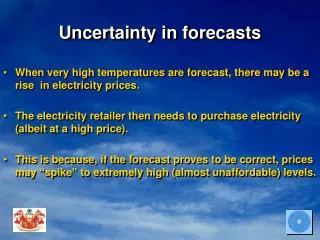
Reasons for Quantifying Uncertainty Benefits of quantifying uncertainty Providing comprehensive results Evaluating the risk to key stakeholders Describing how changes to key assumption could affect the outcome Accounting for highly uncertain assumptions
Methods for Quantifying Uncertainty Historical / Retrospective Analytic Univariate sensitivity analyses Decomposition/Incremental Scenario testing Response surface simulation
Response Surface Simulation Steps Step 1: Quantify the key uncertainties or risks Land use Cost Travel Preferences/Behavior ETC.
Response Surface Simulation Steps Step 2: Design and Conduct Experiments Experimental Design Many Travel Model Runs
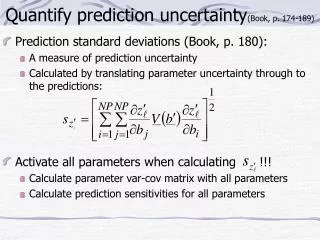
Response Surface Simulation Steps Step 3: Estimate and Apply Response Surface Model in Simulation Regression model to connect model output with uncertain inputs Monte Carlo Simulation to produce probability distributions of performance measures from model outputs
Response surface simulation steps Model Parameters Forecasting Model Future Conditions Response Surface Analysis Historical Data Model review Synthesized Model Probability Distribution of Model Parameters Probability Distribution of Future Conditions Monte Carlo Simulation Forecasting Distribution
Case Study 1 Toledo, Ohio Trip based model Cube Around 600K population
Case Study 2 Chattanooga, Tennessee Activity based model TransCAD Around 450K population
Step 1: Quantify the Key Uncertainties Sources of Uncertainty Generational Modal Preferences Telecommuting Parking cost Transit fare Fuel costs Land Use More …
Probability Distribution for Land Use Land Use • Three mutually exclusive areas: • Urban core • Boom city • Halo area • Distinct scenarios: • Default 2045 from agency • High growth • Low growth • Medium growth • Boom city
Probability Distribution for Telecommuting Telecommuting
Probability Distribution for Fuel Cost Fuel Cost • 1994 to 2014 retail gasoline • 2045 distribution of fuel costs was simulated by growing the 2010 prices
Probability distribution for Transit Fare Transit fare • Policy driven • Weak relationship with economic factors • Assumed to be discrete distribution
Computational Experiments Two Component Steps Experimental Design Run Travel Demand Forecasting Models
Experimental Design Influencing factors for output Key sources of uncertainty in two case studies Land Use Telecommuting Parking Cost Transit Fare Fuel Cost Generational Modal Preferences Urban Core Population Growth Urban Core Employment Growth Halo Area Population Growth Halo Area Employment Growth Boom City Growth Generational Modal Preferences Telecommuting Parking cost Transit fare Fuel cost
Experimental Design 20 Orthogonal fractional factorial experiments
Response Surface Modeling Two Component Steps Response Surface Model Estimation Linear regression in SPSS Monte Carlo Simulation Used Excel add-in Performance Measures of Interest Vehicle Miles Traveled (VMT) Vehicle Hours Traveled (VHT) / Delay Auto and Truck Emissions Transit Ridership
Translating Analysis into Insights Understanding the Impact of Uncertainties A few things (growth, particularly suburban) may drive uncertainty in outcomes (VMT) Other things may havelimited impact (on VMT)
Conclusions Uncertainties inherent in demand forecasts Demand models not efficient for simulating the probability distributions of demand Simple sensitivity analyses do not provide robust information Response surface models can effectively simulate risks associated with much more complex travel demand forecasting models
Jason Chen CONSULTANT jason.chen@rsginc.com 802.359.6431 Vince Bernardin, PhD DIRECTOR vince.bernardin@rsginc.com 812.200.2351