Download
1 / 32
320 likes | 527 Vues
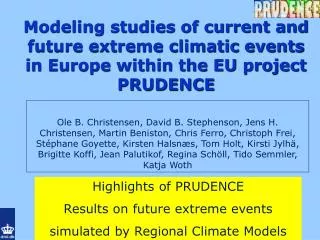
Modeling studies of current and future extreme climatic events in Europe within the EU project PRUDENCE.

E N D
Modeling studies of current and future extreme climatic events in Europe within the EU project PRUDENCE Ole B. Christensen, David B. Stephenson, Jens H. Christensen, Martin Beniston, Chris Ferro, Christoph Frei, Stéphane Goyette, Kirsten Halsnæs, Tom Holt, Kirsti Jylhä, Brigitte Koffi, Jean Palutikof, Regina Schöll, Tido Semmler,Katja Woth Highlights of PRUDENCE Results on future extreme events simulated by Regional Climate Models
PRUDENCE participants • Danish Meteorological Institute, Copenhagen, DK • CINECA, Bologna, IT • Météo-France/CNRM, Toulouse, FRA • Deutsches Zentrum für Luft- und Raumfahrt e.V., Weßling, GER • Hadley Centre for Climate Prediction and Research, Met Office, Bracknell, UK • Climate Research ETH (Eidsgenössische Technische Hochschule), Zürich, CH • GKSS Research Center (Institute for Coastal Research), Geesthacht, GER • Max-Planck-Institut für Meteorologie, Hamburg, GER • Swedish Meteorological and Hydrological Institute, Rossby Centre, Norrköping, SWE • Universidad Complutense, Madrid, SP • Universidad Politecnica, Madrid, SP • International Centre for Theoretical Physics, Trieste, IT • Danish Institute of Agricultural Sciences, Foulum, DK • Risø National Laboratory, System Analysis Dept., DK • University of Fribourg, CH • Finnish Environmental Institute, Helsinki, FIN • University of Reading, UK • University of Lund, SWE • Centre International de Recherche sur l’Environnement et le Développement, SMASH, Paris, FRA • Climate Research Unit, University of East Anglia, UK • Finnish Meteorological Institute, Associated to FEI (No. 16), FIN • Norwegian Meteorological Institute, Blindern, NO • Royal Dutch Meteorological Institute, De Bilt, NL • UQAM, Montreal, CAN • CSIRO, Victoria, AUS • Czech Republic, Israel, Greece, Belgium, Slovakia……………….. • Munich-Re, Electricité de France, Elforsk, Hamburg Institute of International Economics, Uni-Münster, DG-Research, STARDEX, MICE
PRUDENCE objectives • A series of high resolution climate change scenarios for 2071-2100 for Europe • Characterize level of confidence and variability related to model formulations and climate natural/internal variability • Assess the uncertainty in European regional scenarios resulting from model formulation • Quantitatively assess the risks arising from changes in regional climate over Europe, and estimate changes in extremes like heat waves, flooding and wind storms, by providing a robust estimation of the likelihood and magnitude of the changes • Demonstrate the value of the wide-ranging scenarios by applying them to impacts models focusing on effects on adaptation and mitigation strategies • Assess socio-economic and policy related decisions for which such improved scenarios could be beneficial • Disseminate the results of PRUDENCE widely …
A modelling system for detailed regional scenarios – the PRUDENCE method Coupled GCM (300km atmosphere) SST/sea-ice change from coupled GCM 150km global atmospheric GCM Improved circulation from 150km atmospheric GCM 50km regional climate model (RCM) for any region
PRUDENCE protocol • High resolution A-GCM using 1961-1990 observed SSTs • Better control climate than low resolution CGCM • High resolution A-GCM using SST anomalies for 2070-2100 from transient CGCM experiment • Greenhouse gas concentrations and aerosols according to IPCC SRES scenarios (A2, B2) • HadAM3H, HadAM3P (PRECIS), Arpege, FVGCM, ECHAM5
Available daily fields • T_2m (K) • Precipitation (mm/day) • Total cloudiness (Fraction) • Evapotranspiration (mm/day) • Snow water equivalent (mm) • total runoff (mm/d) • soil moisture (mm) • Surface pressure (hPa) • MSLP (hPa) • T_2m_max (K) • T_2m_min (K) • 10-m wind speed (m/s) • 10-m daily max wind speed (m/s) • 2m specific humidity (kg/kg) • net and downward SW and LW radiation (W/m2) positive downward
Availability of data • The PRUDENCE data are now public. Daily, monthly, and seasonal RCM data can be downloaded from http://prudence.dmi.dk/ • Please let us know what you will be doing in order to avoid duplication of efforts • We are happy to answer questions • You must acknowledge the PRUDENCE project
PRUDENCE work on extremes Better understanding of how European weather and climate extremes are likely to change: • Heat waves • Precipitation – heavy and low • Wind storms and storm surges
Methodologies Maxima Percentiles Indices Temperature 99th percentile of daily maximum temperature Number of exceedances of 30°C; number, frequency, duration, and intensity of heat waves (6 consecutive exceedances of 90th temperature percentile) Precipitation Maximum summer 1-day and winter 5-day totals 95th percentile of summer 1-day totals Annual maximum dry- and wet-spell lengths Wind storms Annual maximum storm surge 90th and 99th percentiles of winter 10-metre wind speed; 10th percentile of winter sea-level pressure Number of exceedances of 90th, 95th and 99th wind-speed percentiles; number of exceedances of Beaufort thresholds
Number of days/yr > 30°C 1961-90 HIRHAM CTL 2071-2100 HIRHAM A2 Northward shift of heat waves e.g. Paris: 9 days/yr 50 days/yr
Percentage change in 99th percentile Fraction of change left after correcting for the change in the location (median) HIRHAM After correcting for the change in the location and scale (median and IQR) Changes in variance have a big impact on high extremes
Relative changes in heat wave indices Duration Intensity Frequency Number HIRHAM Increased frequency, intensity and duration of heat waves
5-yr GEV return levels of daily precipitation German Weather Service Obs REMO Control run • RCM is capable of reproducing observed 5-year extremes in Baden-Württemberg, Germany
Changes in HIRHAM 5-year return levels Summer 1-day precipitation 5-day Winter precipitation HIRHAM Increases over Europe except for decreases in south in summer
Christensen & Christensen, Nature (2003) Sensitivity due to GCM and RCM resolution ECHAM HC50km HC25km
Sensitivity of response to RCM Summer precipitation Winter precipitation • More consistent +10% increase in winter • Strong sensitivity to RCM formulation in summer
Uncertainty due to driving GCM Relative change in 95th percentile of summer 1-day precipitation HadAM3H-HIRHAM ECHAM4-HIRHAM HadAM3H-RCAO ECHAM4-RCAO Patterns of change determined by GCM, magnitudes affected by RCM
Uncertainty due to emission scenario Winter 5-day maxima increase; related but smaller increases in means; similar differences between RCMs, GCMs, scenarios, natural variability. Summer 1-day maxima increase; related decrease in means; largest differences due to RCM. Smaller changes for B2 than for A2.
A2 scenario change in max dry spell length HIRHAM+HADRM3+RCAO days • Increased risk of drought in S. Europe esp. Spain/Portugal (one month longer drought/year than present!)
A2 change in 100-yr max wet-spell length HadRM3P RCAO-ECHAM RCAO-HadAM3H HIRHAM • Widespread reductions • Variation due to driving GCM and RCM greater than scenario
% change in 90th percentile of 10-metre wind speed RCAO Increased wind speed intensity in core of Europe north of Alps
Change in mean sea-level pressure CHRM More cyclonic low pressure conditions in winter
A2 changes in max winter surge heights HIRHAM Changes (meters) in max surge heights from HadAM3H / HIRHAM. Largest change of 0.3 metres on coasts near German bight
North Sea surge height changes Changes in surge heights along the North Sea coast (red line). The grey area marks the 95% confidence of interannnual variability, and the four lines the estimates by four participating regional climate models, which all downscale the same global climate change scenario prepared with the Hadley Center model and the A2scenario. Watch out Holland, Germany and Denmark!
Conclusions • Heat waves – increased frequency, intensity, and duration of summer heat waves • Increase in interannual variability of temperature • Heavy precipitation – general increase except over S. Europe in summer. Central Europe will have less rainy days, but probably larger intensities • Droughts – increased risk over S. Europe with much longer dry spells • Wind storms – increased intensity and frequency of high wind speed events in winter • Storm surges – increase in maximum storm surge level of up to 0.3 metres especially near the German Bight.
More details in forthcoming paper … ‘Future extreme events in European climate: An exploration of regional climate model projections’ Beniston et al., 2005 Climatic Change (PRUDENCE special issue)