Process for 2007 Maps
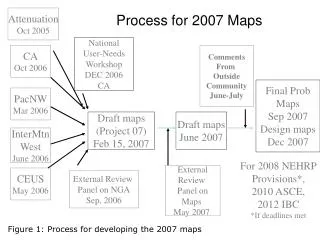
Process for 2007 Maps. Attenuation Oct 2005. National User-Needs Workshop DEC 2006 CA. CA Oct 2006. Comments From Outside Community June-July. Final Prob Maps Sep 2007 Design maps Dec 2007. PacNW Mar 2006. Draft maps (Project 07) Feb 15, 2007. Draft maps June 2007.

Process for 2007 Maps
E N D
Presentation Transcript
Process for 2007 Maps Attenuation Oct 2005 National User-Needs Workshop DEC 2006 CA CA Oct 2006 Comments From Outside Community June-July Final Prob Maps Sep 2007 Design maps Dec 2007 PacNW Mar 2006 Draft maps (Project 07) Feb 15, 2007 Draft maps June 2007 InterMtn West June 2006 For 2008 NEHRP Provisions*, 2010 ASCE, 2012 IBC *If deadlines met External Review Panel on Maps May 2007 CEUS May 2006 External Review Panel on NGA Sep, 2006 Figure 1: Process for developing the 2007 maps
BACKGROUND SOURCE ZONES M 7.0 Figure 2: Two large regional zones for the CEUS.
Wheeler and Johnston Figure 3: Global earthquake data for craton and margin earthquakes.
Wheeler and Johnston Figure 4: Histograms showing magnitudes for craton and margin earthquakes.
New Madrid seismicity Northern Arm Reelfoot fault Southern Arm Blytheville Figure 6 Kentucky Geological Survey SP6
NEW MADRID LOGIC TREE 7.8 Figure 7: New Madrid logic tree
Figure 8: Alternative source zones near Charleston, South Carolina and logic tree
Figure 9: CEUS 0.2 s SA attenuation relations for M 7 earthquake on Vs30 760 m/s site conditions: AB95 AB05 (Atkinson and Boore, 1995, 2005; F96 (Frankel et al., 1996); T97 T02m (Toro, 1997, 2002); C03 (Campbell, 2003); S01 (Somerville 2001); SV02 (Silva et al., 2002); TP05 (Tavakoli And Pezeshk, 2005)
Figure 10: CEUS 1 s SA attenuation relations for M 7 earthquake on Vs30 760 m/s site conditions: AB95 AB05 (Atkinson and Boore, 1995, 2005; F96 (Frankel et al., 1996); T97 T02m (Toro, 1997, 2002); C03 (Campbell, 2003); S01 (Somerville 2001); SV02 (Silva et al., 2002); TP05 (Tavakoli And Pezeshk, 2005)
Zeng and Shen 2006 Figure 12: GPS strain data for the western U.S.
Figure 13: Faults in the western U.S. showing style of faulting
Geodetic rupture depth Figure 14: Fault geometry used in the Cascadia subduction zone
Provided by Ken Campbell, EQECAT Previous Data New Data NGA Project Database • NGA strong-motion database: • 172 worldwide earthquakes • 1,400 recording stations • 3,500 multi-component strong-motion recordings • Over 100 parameters describing source, path, and site conditions Figure 16: Strong motion dataset prior to NGA database (red) in NGA database (blue)
Chiou and Youngs-solid Sadigh et al.-dashed Figure 17: Comparison of new NGA equation (Chiou and Youngs) and older Equation by Sadigh et al. (1997) used in 2002 maps.
Figure 18: 2007 draft national seismic hazard map for CEUS at 0.2 s SA and 2% probability of exceedance in 50 years on firm rock site condition 760 m/s Vs30.
Figure 19: 2007 draft national seismic hazard map for CEUS at 1.0 s SA and 2% probability of exceedance in 50 years on firm rock site condition 760 m/s Vs30.
Figure 20: Ratio of 0.2 s SA 2007 and 2002 national seismic hazard maps for CEUS at 2% probability of exceedance in 50 years.
Figure 21: Ratio of 1.0 s SA 2007 and 2002 national seismic hazard maps for CEUS at 2% probability of exceedance in 50 years.
Figure 22: 2007 draft national seismic hazard map for WUS at 0.2 s SA at 2% probability of exceedance in 50 years on firm rock site condition 760 m/s Vs30.
Figure 23: 2007 draft national seismic hazard map for WUS at 1.0 s SA at 2% probability of exeedance in 50 years on firm rock site condition 760 m/s Vs30.
Figure 24: Ratio of 0.2 s SA 2007 and 2002 national seismic hazard maps for WUS at 2% probability of exceedance in 50 years.
Figure 25: Ratio of 1.0 s SA 2007 and 2002 national seismic hazard maps for WUS At 2% probability of exceedance in 50 years.
Testing the model: Figure 26: Comparison of 1996 seismic hazard maps with seismicity since 1996.