Download
1 / 5
50 likes | 107 Vues
Study on REE ions enrichment efficiency in microchannel using UV/Vis spectrophotometry & MP-AES analysis. Results indicate potential for separation of enriched and depleted streams.

E N D
The influence of the residence time of the REE ions in the microchannel on their enrichment efficiency M. Luty-Błocho, K. Kolczyk, M. Wojnicki and P. Zabinski BR2018 – 2nd conference on Bauxite Residue Valorisation and Best Practices
Materials and methods Materials: an aqueous solution of HoCl3 (Avantor), concentration of Ho3+ ions in the range 0.01 – 0.1M, pH =1, T=20ºC, Flow rates: 5 – 30mL/h. Methods: Obtained solution were collected and analyzed using UV/Vis spectrophotometry and MP-AES (Microwave Plasma-Atomic Emission Spectrometer). BR2018 – 2nd conference on Bauxite Residue Valorisation and Best Practices
Set up for separation two streams (enriched and depleted) Figure 1. Set up BR2018 – 2nd conference on Bauxite Residue Valorisation and Best Practices
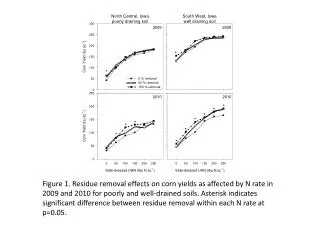
Results where Absλ is the absorbance value in a given wavelength[nm], ελ is molar coefficient of absorption [dm3×cm-1×mol-1], ldenotes path length [cm] and C isconcentration of Ho(III) ions [mol×dm-3] Figure 2.Spectra for Ho(III) ions with different concentration (H0(0.1M)-H5(0.01M) (a); Dependency of A vs. concentration (b); An exemplary spectrum of UV-Vis of Ho(III), square markers-analyzed spectra maximums (A: 537nm, B: 641nm), rectangular marker – correction of the spectrum level (C: 590 – 610 nm) (c); Change of absorbance vs. flow rate for different concentration of Ho(III) ions in the solution.
Conclusions • The process of ionsseparationwerecarried out in inhomogeneousmagnetic field; • For ionsseparation, the specialcell (microreactor) was fabricatedusing 3D printing technology; • The differences of absorbance from outputs of microreactorwere observed but the values were generally include the error bars; • The error bars were about the same or bigger range as the observed enrichment effect. BR2018 – 2nd conference on Bauxite Residue Valorisation and Best Practices