Download
1 / 42
420 likes | 468 Vues
Explore Carl Linnaeus' scientific naming system, limitations of Linnaean classification, modern evolutionary classification like cladistics, and molecular clocks in evolutionary history estimation.

E N D
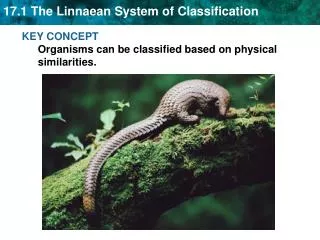
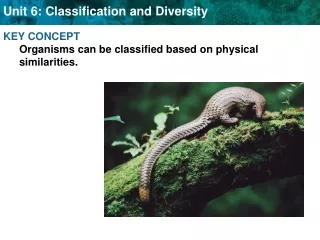
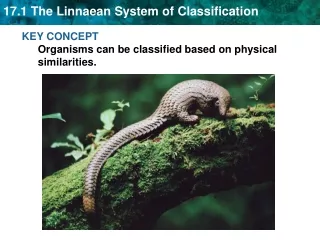
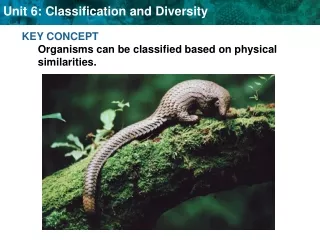
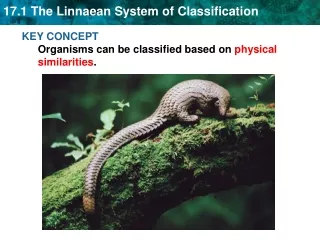
KEY CONCEPT Organisms can be classified based on physical similarities.
Carl Linnaeusdeveloped the scientific naming system still used today. • Taxonomy is the science of naming and classifying organisms. White oak:Quercus alba • A taxon is a group of organisms in a classification system.
uses Latin words • scientific names always written in italics • two parts are the genus name and species descriptor • Binomial nomenclature is a two-part scientific naming system. e.g. Homo sapiens Common name: humans
A genus includes one or more physically similar species. • Species in the same genus are thought to be closely related. • Genus name is always capitalized. • A species descriptor is the second part of a scientific name. • always lowercase • always follows genusname; never written alone Tyto alba
Scientific names help scientists to clearly communicate about species. • Some species have very similarcommon names. • Some species have manycommon names.
Linnaeus’ classification system has seven levels. • Each level is included in the level above it. • Levels get increasingly specific from kingdom to species.
The Linnaean classification system has limitations. • Linnaeus taxonomy doesn’t account for molecular evidence such as DNA sequencing. • The technology didn’t exist during Linneaus’ time. • Linnaean system based only on physical similarities.
Physical similarities are not always the result of close relationships. • Genetic similarities more accurately show evolutionary relationships.
KEY CONCEPT Modern classification is based on evolutionary relationships.
Cladistics is classification based on common ancestry. • Phylogeny is the evolutionary history for a group of species. • evidence from living species, fossil record, and molecular data is used • shown with branching tree diagrams like below
species placed in order that they descended from common ancestor • Cladistics is a common method to make evolutionary trees.
A cladogram is an evolutionary tree made using cladistics. • A clade is a group of species that shares a common ancestor. • Each species in a clade shares some traits with the ancestor. • Each species in a clade has traits that have changed.
1 Tetrapoda clade 2 Amniota clade 3 Reptilia clade 4 Diapsida clade 5 Archosauria clade FEATHERS & TOOTHLESS BEAKS. SKULL OPENINGS IN FRONT OF THE EYE & IN THE JAW OPENING IN THE SIDE OF THE SKULL SKULL OPENINGS BEHIND THE EYE EMBRYO PROTECTED BY AMNIOTIC FLUID FOUR LIMBS WITH DIGITS DERIVED CHARACTER • Derived characters are traits shared in different degrees by clade members. • basis of arranging species in cladogram • more closely related species share more derived characters • represented on cladogram as hash marks
CLADE 1 Tetrapoda clade 2 Amniota clade 3 Reptilia clade 4 Diapsida clade 5 Archosauria clade NODE FOUR LIMBS WITH DIGITS DERIVED CHARACTER • Nodesrepresent the most recent common ancestor of a clade. • Clades can be identified by snipping a branch under a node. FEATHERS AND TOOTHLESS BEAKS. SKULL OPENINGS IN FRONT OF THE EYE AND IN THE JAW OPENING IN THE SIDE OF THE SKULL SKULL OPENINGS BEHIND THE EYE EMBRYO PROTECTED BY AMNIOTIC FLUID
Molecular evidence reveals species’ relatedness. • Molecular data may confirm classification based on physical similarities. • Molecular data may lead scientists to propose a new classification. • DNA is usually given the last word by scientists.
Examples of scientific classification • Classification systems are used to organize information. Most systems of classification use standard principles of organization, where data is divided into the broadest categories and then organized into subgroups. • Look at each fingerprint below. Criminologists use a system for classifying fingerprints to make it easier to compare. What categories would you divide them in to?
How scientists describe fingerprints: • Loops: start and end on the same side, which is the same side as the opening of the loop. • Arches: go from one side to the other • Whorls: roughly circular, ridge lines go all the way around.
KEY CONCEPT Molecular clocks provide clues to evolutionary history.
Mutations add up at a fairly constant rate in the DNA of species that evolved from a common ancestor. Ten million years later— one mutation in each lineage Another ten million years later— one more mutation in each lineage Molecular clocks use mutations to estimate evolutionary time. • Mutations add up at a constant rate in related species. • This rate is the ticking of the molecular clock. • As more time passes, there will be more mutations. The DNA sequences from two descendant species show mutations that have accumulated (black). The mutation rate of this sequence equals one mutation per ten million years. DNA sequence from a hypothetical ancestor
Scientists estimate mutation rates by linking molecular data and real time. • an event known to separate species • the first appearance of a species in fossil record
Mitochondrial DNA and ribosomal RNA provide two types of molecular clocks. • Different molecules have different mutation rates. • higher rate, better for studying closely related species • lower rate, better for studying distantly related species
grandparents mitochondrial DNA nuclear DNA parents Mitochondrial DNA is passed down only from the mother of each generation,so it is not subject to recombination. child Nuclear DNA is inherited from both parents, making it more difficult to trace back through generations. • Mitochondrial DNA is used to study closely related species. • mutation rate ten times faster than nuclear DNA • passed down unshuffled from mother to offspring
Ribosomal RNA is used to study distantly related species. • many conservative regions • lower mutation rate than most DNA
Plantae Animalia Classification is always a work in progress. • The tree of life shows our most current understanding. • New discoveries can lead to changes in classification. • Until 1866: only two kingdoms,Animalia and Plantae
Protista Classification is always a work in progress. • The tree of life shows our most current understanding. • New discoveries can lead to changes in classification. • Until 1866: only two kingdoms,Animalia and Plantae Plantae Animalia • 1866: all single-celled organisms moved to kingdom Protista
Plantae Animalia Protista Monera Classification is always a work in progress. • The tree of life shows our most current understanding. • New discoveries can lead to changes in classification. • Until 1866: only two kingdoms,Animalia and Plantae • 1866: all single-celled organisms moved to kingdom Protista • 1938: prokaryotes moved to kingdom Monera
Plantae Animalia Protista Fungi Classification is always a work in progress. • The tree of life shows our most current understanding. • New discoveries can lead to changes in classification. • Until 1866: only two kingdoms,Animalia and Plantae • 1866: all single-celled organisms moved to kingdom Protista • 1938: prokaryotes moved to kingdom Monera • 1959: fungi moved to own kingdom Monera
Plantae Animalia Protista Archea Bacteria Fungi Classification is always a work in progress. • The tree of life shows our most current understanding. • New discoveries can lead to changes in classification. • Until 1866: only two kingdoms,Animalia and Plantae • 1866: all single-celled organisms moved to kingdom Protista • 1938: prokaryotes moved to kingdom Monera • 1959: fungi moved to own kingdom • 1977: kingdom Monerasplit into kingdoms Bacteria and Archaea
The three domains in the tree of life are Bacteria, Archaea, and Eukarya. • Domains are above the kingdom level. • proposed by Carl Woese based on rRNA studies of prokaryotes • domain model more clearly shows prokaryotic diversity
Domain Bacteria includes prokaryotes in the kingdom Bacteria. • one of largest groups on Earth • classified by shape, need for oxygen, and diseases caused
Domain Archaea includes prokaryotes in the kingdom Archaea. • cell walls chemically different from bacteria • differences discovered by studying RNA • known for living in extreme environments
Domain Eukarya includes all eukaryotes. • kingdom Protista
Domain Eukarya includes all eukaryotes. • kingdom Protista • kingdom Plantae
Domain Eukarya includes all eukaryotes. • kingdom Protista • kingdom Plantae • kingdom Fungi
Domain Eukarya includes all eukaryotes. • kingdom Protista • kingdom Plantae • kingdom Fungi • kingdom Animalia
bridge to transfer DNA • Bacteria and archaea can be difficult to classify. • transfer genes among themselves outside of reproduction • blurs the linebetween “species” • more researchneeded tounderstand prokaryotes