The bell shape curve
The bell shape curve . Normal distribution FETP India. Competency to be gained from this lecture. Use the properties of normal distributions to estimate the proportion of a population between selected values. Key issues. Normal distribution Properties of the normal distribution Z score.


The bell shape curve
E N D
Presentation Transcript
The bell shape curve Normal distributionFETP India
Competency to be gained from this lecture Use the properties of normal distributions to estimate the proportion of a population between selected values
Key issues • Normal distribution • Properties of the normal distribution • Z score
Frequency distribution • For a continuous variable, the values taken by the variable may be listed • One can examine how commonly the variable will take specific values • The relative frequency with which the variable is taking selected values is called a frequency distribution Normal distribution
Distribution • We observe the frequency distribution of values • If we smoothen the distribution, we obtain a curve • If the curve can correspond to a mathematical formula, we can apply formula that allow predicting a number of parameters Normal distribution
The normal curve presented as an histogram Normal distribution
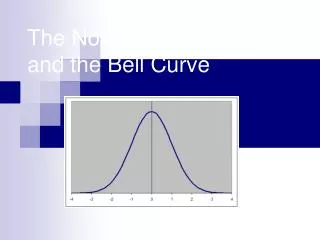
Observation • Many naturally occurring events follow a rough pattern with: • Many observations clustered around the mean • Few observations with values away from the mean • This bell-shaped curve was named Normal distribution by a mathematician called Gauss Normal distribution
The normal distribution • Normal distribution • The symmetrical clustering of values around a central location • Normal curve • The bell-shaped curve that results when a normal distribution is graphed Normal distribution
Properties of the normal distribution of a continuous variable • Symmetric about its mean • The median = the mode = the mean • The entire distribution is known if two parameters are known: • The mean • The standard deviation Properties
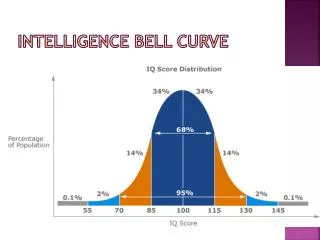
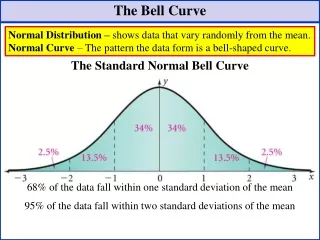
Additional properties of the normal distribution • 68% of the values lie between: • Mean + one standard deviation • Mean - one standard deviation • 95% of the values lie between: • Mean + two standard deviations • Mean - two standard deviations • > 99% of the values lie between • Mean + three standard deviations • Mean - three standard deviations Properties
Distribution of the values according to the standard deviation
Characterizing a normal distribution • The mean specifies the location • The standard deviation specifies the spread • Hence: • For different values of mean or standard deviation or both, • We get different normal distributions. Properties
Usefulness of the normal distribution • Many statistical tests are based on the assumption that the variable is normally distributed in the population • Using the standard deviation it is possible to: • Describe the “normal” range between x-standard deviations • Compare the degree of variability in the distribution of a factor: • Between two populations • Between two different variables in the same population Properties
Distributions that are approximately normal • For distributions that are approximately normal: • Unimodal (One mode) • Symmetrical • Having a bell shaped curve • The standard deviation and the mean together provide sufficient information to describe the distribution totally Properties
z-score • Every normal distribution can be standardized in terms of a quantity called the normal deviate (z) • The z score is an index of the distance from the mean in units of standard deviations Z-score
Standardizing a normal distribution • Z is defined as: • Observation - Mean • Z =----------------------------------------- • Standard deviation • The probabilities associated with normal distribution are obtained from the knowledge of z Z-score
Representing a normal curve on a standard deviation scale Mean One standard deviation Minus one standard deviation The x-axis expresses the data values in a standardized format
Knowing what proportion of the values lies between two values Between the mean and + 1 standard deviation, there is 68% / 2 = 34% of the values Z-score
Area under the curve and Z-score • What proportion of the population is between between 0 and 1.96? Z-score
First example of use of the normal distribution: Heights • We are examining a population of persons with heights that are normally distributed • Consider the normal distribution of heights: • Mean height = X = 65" • Standard deviation = SD = 2" Z-score
What is the proportion of persons whose height exceeds 68”? • Normal deviate • Z = (x-x)/SD = (68-65)/2 = 1.5 • The area under the curve from Z = 1.5 to : • 0.0668 • 6.68% • 6.68% of persons have a height that exceeds 68" Z-score
What is the proportion of persons whose height is less than 60”? • Normal deviate : • Z = (x-x)/SD = (60 - 65 ) / 2 = - 2.5 • The area under the curve from z = - to z = -2.5 is equal to the one from Z = 2.5 to z = + • The area under the curve from Z = 2.5 to : • 0.0062 • 0.62% • 0.62% of persons have a height below 60” Z-score
What is the proportion of persons whose height is between 64 " and 67 ” (1/2)? } • Normal deviate for x=64”: • Z1 =(65-64)/2 = - 0.5 • Area under the curve: • From Z1 = - to - 0.5 = • From Z1 = 0.5 to • Proportion of the population with height less than 64”: • 0.3085 • 30.8 Z-score
What is the proportion of persons whose height is between 64 " and 67 ” (2/2)? • Normal deviate for X=67" = Z2 = (67-65)/2 = • Area under the curve from Z2 = 1 to • 0.1587 • 15.8% of the population has a height exceeding 67" • Heights between 64" and 67’’ • 1 - 0.3085 - 0.1587 = 0.5328 = 53.28% Z-score
Second example of use of the normal distribution: Cholesterol level • We are examining a population of persons with cholesterol levels that are normally distributed • Consider the normal distribution of cholesterol levels: • Mean cholesterol = 242 mg % • Standard deviation = 45 mg % Z-score
Example 2: What is the cholesterol level exceeded by 10% of men? • What is the Z corresponding to an area of 10% (0.1) on the right? • The Z value from the table is: • 1.282 • Z = (x-242)/45 =1.3 • X - 242 = 1.3 x 45 = 58.5 • X= 58.5 + 242 = 300.5 mg% Z-score
What is the cholesterol level that is exceeded by 2.5% of men ? • What is the Z corresponding to 2.5% of the area (0.025) on the left? • From the table, • Z corresponding to an upper area of 0.025 = 1.96 • By symmetry, the lower value of Z is -1.96 • (x-x) / SD = z • (x-242) /45 = -1.96 • (x-242) /45 = -1.96 • X – 242 = -1.96 x 45 = - 88.2 • X = 242 - 88.2 = 153.8 mg% Z-score
How does one know the distribution is normal? • Is the distribution symmetrical? • A normal distribution is symmetrical • Is the distribution skewed? • A normal distribution is not skewed • What is the kurtosis of the distribution? • The normal distribution is neither too sharp nor too shallow • Computer programmes are available to test the normality of the distribution Z-score
Scores and normal curve Z-score
Key messages • The symmetrical clustering of values around a central location is called a normal distribution • Normal distributions are symmetric, have a common value for the mean, the median and the mode and are solely characterized by their mean and their standard deviation • Z-scores allow estimating the proportion of the population lying between selected values