Enhancing Ozone Monitoring System for Better Understanding and Visualization
Explore possible improvements like species labels, station identification, additional indicators, and a customizable interface for more accurate ozone data analysis and visualization.

Enhancing Ozone Monitoring System for Better Understanding and Visualization
E N D
Presentation Transcript
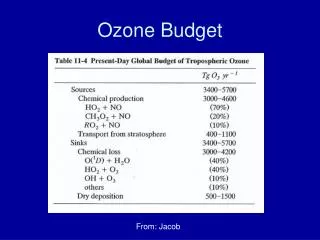
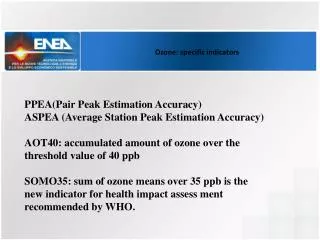
Ozone: specific indicators PPEA(Pair Peak Estimation Accuracy) ASPEA (Average Station Peak Estimation Accuracy) AOT40: accumulated amount of ozone over the threshold value of 40 ppb SOMO35: sum of ozone means over 35 ppb is the new indicator for health impact assess ment recommended by WHO.
Possible improvements (additions/changes) which might be helpful for applications Can be used a script to produce multiple graphs? Can be added a window to show the number of selected stations from all available?
Possible improvements (additions/changes) which might be helpful for applications Can be added the name of the species on the graph?
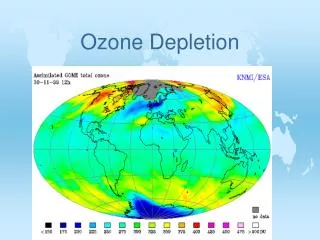
Possible improvements (additions/changes) which might be helpful for applications On the geo map, the stations cannot be identified. Can be added a number for each station for example and a legend with number and name?