Download
1 / 27
270 likes | 363 Vues
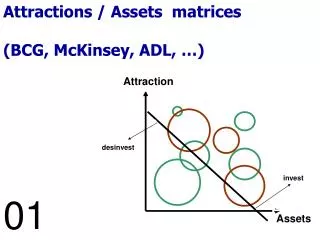
Explore various matrices such as McKinsey's Industry Attractiveness/Company Strength, Directional Policy Matrix, and Growth-Share Matrix to evaluate business strategies. Gain insights on market segmentation, investment, growth, and selective strategies.

E N D
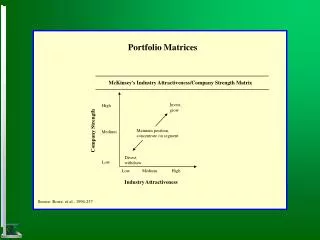
Portfolio Matrices McKinsey's Industry Attractiveness/Company Strength Matrix Invest, grow High Company Strength Maintain position, concentrate on segment Medium Divest, withdraw Low Low Medium High Industry Attractiveness Source: Rowe, et al., 1994:257
Directional Policy Matrix (DPM) Market segmentation Market leadership; innovation High Diversification Maintenance of position; market penetration Expansion; product Differentiation Phased withdrawal; merger Normal Company Capability Imitation; Phased withdrawal Cash generation Low Divestment Unattractive Average Attractive Market Potential Source: Rowe, et al., 1994:257
19x1 19x0 Total market - Total market Total market 19x0 19xl Business sales Leading competitor's sales 19xl The Growth-Share Matrix Matrix Relative Market Share High Low Star Question Mark High Market Growth Low Cash Cow Dog Dimensions of the Matrix J External: Market growth rate (%) = x 100 (year 19xl) JInternal: Relative market share = (year 19xl) Cut-off points J Horizontal: Industry growth rate, or GNP growth rate, or weighted average of in- dustries growth rate, or managerial objective for overall growth J Vertical: Relative market share equal to 1 for separating leadership from fol- lowership, or equal to 1.5 to indicate strong leadership or dominance Source: Hax & Majluf, 1991:186
Business Category Market Share Thrust Business Profitability Investment Required Net Cash Flow Around zero or slightly negative High Stars Hold/increase High Hold Cash Cows High Highly positive Low Increase None or negative Low or negative Very high Highly negative Question Marks H Harvest/ Divest Positive Disinvest Harvest/ Divest Disinvest Low or negative Positive Dogs HThere is a selective application of the strategy depending on the decision made with regard to the business: either to enter aggressively or withdraw. Source: Hax & Majluf, 1991:186
Investment and growth Selective growth Selective growth Harvest/ Divest Harvest/ Divest Harvest/ Divest The Industry Attractiveness-Business Strength Matrix Industry Attractiveness Matrix High Medium Low High Selectivity Business Strength Medium Selectivity Low Selectivity Dimensions of the Matrix JIndustry Attractiveness: Subjective assessment based on external factors, noncontrollable by the firm, that are intended to capture the industry and competitive structure in which the business operates JBusiness Strength: Subjective assessment based on the critical success factors, largely con- trollable by the firm, that define the competitive position of a business within its industry Source: Reproduced from A.T. Kearney, Inc., Chicago, III. by Hax & Majluf, 1991:187
Industry Attractiveness Generic Strategies High Low Medium Identify growth segments Invest strongly Maintain position elsewhere Maintain overall position Seek cash flow Invest at maintenance level Grow Seek dominance Maximize investment High Evaluate potential for leadership via segmentation Identify weaknesses Build strengths Prune lines Minimize investment Position to divest Identify growth segments Specialize Invest selectively Medium Business Strength Trust leader's statesmanship Sic on competitor's cash generators Time exit and divest Specialize Seek niches Consider acquisitions Specialize Seek niches Consider exit Low Source: Reproduced from A.T. Kearney, Inc., Chicago, III. by Hax & Majluf, 1991:187
The Life-Cycle Portfolio Matrix (Hax & Majluf, 1991:188-192) Matrix Maturity Mature Aging Growth Embryonic Dominant Strong Favorable Competitive Position Tenable Weak Nonviable Wide range of strategic options Caution, selective development Danger, withdraw to market niche, divest or liquidate
DEVELOPMENT STAGE Dimension of the Matrix Aging Embryonic Growth Mature DESCRIPTORS Market Growth Rate Equal to or slower than GNP, cyclical Faster than GNP, but constant or decelerating Industry volume cycles but declines over long term Accelerating; meaningful rate cannot be calculated because the base is too small • External: Stages of industry maturity judgmentally assessed based on the following eight external factors and their corresponding description Well-known; primary markets approach saturation industry volume Substantially exceeds the industry volume, but is subject to unforeseen developments Industry Potential Usually difficult to determine Saturation is reached; no potential remains Breadth of Product Lines Basic product line established Rapid proliferation as product lines are extended Product turnover, but little or no change in breadth Shrinking Increasing to peak; followed by shake-out and consolidation Increasing rapidly Number of Competitors Stable Declines; but business may break up into many small regional suppliers Concentration increases as marginal firms drop out; or shares are dispersed among small local firms Market Share Stability A few firms have major shares; rankings can change, but those with minor shares are unlikely to gain major shares Volatile Firms with major shares are entrenched Purchasing Patterns Little or none Suppliers are well known; buying patterns are estab- lished Some; buyers are aggressive Strong; number of alternatives decreases Usually easy, the presence of competitors is offset by vigorous growth Difficult; competitors are entrenched, and growth is slowing Ease of Entry Usually easy, but opportunity may not be apparent Difficult; little incentive Role is minimal Technology Concept development and product engineering Product line refinement and extension Process and materials refinement; new product line development to renew growth
Dimensions of the Matrix (cont.) JInternal: Competitive position of the business arrived at judgmentally, based on the following six com- petitive categories: Criteria for Classification of Competitive Position 1. Dominant: Dominant competitors are very rare. Dominance often results from a quasi monopo- ly or from a strongly protected technological leadership. 2. Strong: Not all industries have dominant or strong competitors. Strong competitors can usually follow strategies of their choice, irrespective of their competitors' moves. 3. Favorable: When industries are fragmented, with no competitor clearly standing out, the leaders tend to be in a favorable position. 4. Tenable: A tenable position can usually be maintained profitably through specialization in a nar- row or protected market niche. This can be a geographic specialization or a product specializa- tion. 5. Weak: Weak competitors can be intrinsically too small to survive independently and profitably in the long term, given the competitive economics of their industry, or they can be larger and po- tentially stronger competitors, but suffering from costly past mistakes or from a critical weak- ness. 6. Nonviable: Represents the final recognition that the firm has really no strength whatsoever, now or in the future, in that particular business, and therefore, exiting is the only strategic response.
Generic Strategies A. Market share thrust Embryonic Growth Mature Aging All out push for share Hold position Hold position Hold share Hold position Grow with industry Dominant Strong Favorable Tenable Weak Hold position Attempt to improve position All out push for share Attempt to improve position Push for share Hold position Grow with industry Hold position or Harvest Selective or all out push for share Selectively attempt to improve position Attempt to improve position Selective push for share Custodial or maintenance Find niche and attempt to protect Harvest or Phased withdrawal Selectively push for position Find niche and protect it Find niche and hang on or Phased withdrawal Phased withdrawal or Abandon Up or Out Turnaround or Abandon Turnaround or Phased withdrawal Abandon
B. Investment requirements Embryonic Growth Mature Aging Invest to sustain growth rate (and preempt new [?] competitors) Reinvest as necessary Reinvest as necessary Invest slightly faster than market dictates Dominant Strong Favorable Tenable Weak Minimum reinvestment or Maintenance Invest as fast as market dictates Reinvest as necessary Invest to increase growth rate (and improve position) Minimum maintenance Investment or Disinvest Minimum and/or Selective reinvestment Selective investment to improve position Invest selectively Minimum reinvestment or Disinvest Disinvest or Divest Selective investment Invest (very) selectively Invest selectively or Disinvest Divest Invest or Divest Invest or Divest The terms invest and divest are used in the broadest sense and are not restricted to property, plant, and equipment.
C. Profitability and cash flow Embryonic Growth Mature Aging Probably profitable but not necessary Net cash borrower Profitable Probably net cash producer (but not necessary) Profitable Net cash producer Profitable Net cash producer Dominant Strong Favorable Tenable Weak May be unprofitable Net cash borrower Probably profitable Probably net cash borrower Profitable Net cash producer Profitable Net cash producer Probably unprofitable Net cash borrower Marginally profitable Net cash borrower Moderately profitable Net cash borrower Moderately profitable Cash flow balance Unprofitable Net cash borrower or Cash flow balance Minimally profitable Cash flow balance Unprofitable Net cash borrower Minimally profitable Cash flow balance Unprofitable Net cash borrower Unprofitable Net cash borrower or Cash flow balance Unprofitable Possibly net cash borrower or Net cash producer Unprofitable (Write-off) In addition, to cash throw-off or use, each unit may use or throw-off managerial resources. Note: In some cases, the tax shield value of a unit should be taken into account in evaluating unit performance. In addition to the previously prescribed generic strategies, the ADL methodology recommends broad action programs depending on the position of the business unit in its matrix. The strategies of business units are categorized according to four different families: natural development, selective development, prove viability, and out, which are broadly char- acterized in the following display.
Stages of industry Maturity Embryonic Growth Mature Aging Competitive Position Dominant Strong Natural development Favorable Selective development Prove viability Tenable Out Weak Source: Arthur D. Little, Inc. Each family of businesses has the following options regarding the definition of its strategic thrusts: Natural DevelopmentSelective DevelopmentProve ViabilityOut Start-up Find niche Catch-up Withdraw Growth with industry Exploit niche Renew Divest Gain position gradually Hold niche Turnaround Abandon Gain position aggressively Prolong existence Defend position Harvest Once having selected the appropriate strategic thrust from among the ones available for each family, you are offered the following menu of broad action programs: A Backward integration M Market rationalization B Development of overseas business N Methods and functions efficiency C Development of overseas facilities O New products/New markets D Distribution rationalization P New products/Same market E Excess capacity Q Production rationalization F Export/Same product R Product line rationalization G Forward Integration S Pure survival H Hesitation T Same products/New markets I Initial market development U Same products/Same markets J Licensing abroad V Technology efficiency K Complete rationalization W Traditional cost-cutting efficiency L Market penetration X Unit abandonment The ADL methodology suggests the following mapping among families, strategic thrusts, and broad action programs:
Generic Strategies Strategies A B C D F G H I J L N Q R X U K E M O P S T V W Strategic Thrust NATURAL DEVELOPMENT Start-up L E I Growth with industry A F P B C G J N T U Gain position gradually L T G Gain position aggressively C B L N O P T V G E Defend position A C U V W N Harvest D H Q R W K M U SELECTIVE DEVELOPMENT Find niche R T A I M G L Exploit niche C U B L N P E V Hold niche C N Q U D PROVE VIABILITY Catch-up Strategic Thrust D L M P Q R E Renew U D Q M O P R Turn around W D L N Q R V M Prolong existence S D K N Q R T W A J M F WITHDRAWAL Withdraw Q M R D W Divest Q R S D K Abandon X Source: Arthur D. Little, Inc.
The Alternative Boston Consulting Group Matrix Matrix Size of Competitive Advantage Small Large Many Fragmented Specialization Ways to Compete (Opportunities for differentiation) Few Stalemate Volume Dimensions of the Matrix J Ways to Compete: Assess judgmentally whether there are many or few ways to achieve com- petitive advantage. This is greatly determined by the capabilities of dif- ferentiation within the industry. J Size of Competitive Advantage: Assess judgmentally whether the extent and sustainability of the advantage is small or large. This is largely dependent on the size of barriers to entry into the industry.
Generic Strategy Generic Strategy Category of Business J Lowest cost position, sales leadership J Either niche in a segment of the market or cover the entire market with differentiated products J Do not get stuck in the middle J Many ways to compete. Look at your relative strengths and unique competencies J Survive, reduce costs, maximize productivity Volume Specialization Fragmented Stalemate Source: Hax & Majluf, 1991:193
Strategic Position and Action Evaluation (SPACE) (Rowe, et al., 1994:255-270) SPACE Chart High Company’s Financial Strength (FS) 6 Conservative Aggressive 5 4 3 2 High Low 1 Low High -6 -5 - 4 -3 -2 -1 1 2 3 4 5 6 - 1 Company’s Competitive Advantage (CA) Industry Strength (IS) - 2 - 3 High - 4 Defensive Competitive - 5 - 6 Environmental Stability (ES) Low
AGGRESSIVE POSTURE . FS Aggressive Strength on all dimensions CA IS ES This posture is typical in an attractive industry with little environmental turbulence. The company enjoys a definite competitive advantage, which it can protect with financial strength. The critical factor is entry of new competition. Firms in this situation should take full advantage of opportunities, look for acquisition candidates in their own or related industries, increase market share, and concentrate resources on products that have a definite competitive edge. Source : Rowe, et al., 1994, p.260.
COMPETITIVE POSTURE FS Competitive advantage in good industry... CA IS ...but relative weakness in financial and environmental stability . Competitive ES This posture is typical in an attractive industry. The company enjoys a competitive advantage in a relatively unstable environment. The critical factor is financial strength. Firms in this situation should acquire financial resources to increase marketing thrust, add to the sales force, extend or improve the product line, invest in productivity, reduce costs, protect competitive advantage in a declining market, and attempt to merge with a cash-rich company. Source : Rowe, et al., 1994, p.260.
CONSERVATIVE POSTURE . FS Conservative Financially sound... CA IS ...but market is very competitive and it is waning ES This posture is typical in a stable market with low growth. Here the company focuses on financial stability. The critical factor is product competitiveness. Firms in this situation should prune the product line, reduce costs, focus on improving cash flow, protect competitive products, develop new products, and gain entry into more attractive markets. Source : Rowe, et al., 1994, p.260-261.
DEFENSIVE POSTURE FS CA IS . Relative weakness on ost dimensions Defensive ES This posture is typical of an unattractive industry in which the company lacks a competitive product and financial strength. The critical factor is competitiveness. Firms in this situation should prepare to retreat from the market, discontinue marginally profitable products, reduce costs aggressively, cut capacity, and defer or minimize investments. Source : Rowe, et al., 1994, p.261.
R C E Factors Determining Environmental Stability : Technological changes Rate of inflation Demand variability Price range of competing products Barriers to entry into market Competitive pressure/rivalry Price elasticity of demand Pressure from substritute products Many High Large Wide Few High Elastic High 0 1 2 3 4 5 6 0 1 2 3 4 5 6 0 1 2 3 4 5 6 0 1 2 3 4 5 6 0 1 2 3 4 5 6 0 1 2 3 4 5 6 0 1 2 3 4 5 6 0 1 2 3 4 5 6 Few Low Small Narrow Many Low Inelastic Low Note : R = Relative importance of factor C = Chance of sustaining E = Combined effect
R C E Factors Determining Industry Strength : Low Low Low Simple Inefficient Low Easy Low Low Growth potential Profit potential Financial stability Technological know-how Resource utilization Capital intensity Ease of entry into market Productivity, capacity utilization Manufacturers’ bargaining power 0 1 2 3 4 5 6 0 1 2 3 4 5 6 0 1 2 3 4 5 6 0 1 2 3 4 5 6 0 1 2 3 4 5 6 0 1 2 3 4 5 6 0 1 2 3 4 5 6 0 1 2 3 4 5 6 0 1 2 3 4 5 6 High High High Complex Efficient High Difficult High High Note : R = Relative importance of factor C = Chance of sustaining E = Combined effect
R C E Factors Determining Competitive Advantage: Market share Product quality Product life cycle Product replacement cycle Customer loyalty Competition’s capacity utilization Technological know-how Vertical integration Speed of new product introductions Small Inferior Late Variable Low Low Low Low Slow 0 1 2 3 4 5 6 0 1 2 3 4 5 6 0 1 2 3 4 5 6 0 1 2 3 4 5 6 0 1 2 3 4 5 6 0 1 2 3 4 5 6 0 1 2 3 4 5 6 0 1 2 3 4 5 6 0 1 2 3 4 5 6 Large Superior Early Fixed High High High High Fast Note : R = Relative importance of factor C = Chance of sustaining E = Combined effect
R C E Factors Determining Financial Strength : Low Imbalanced Imbalanced High Low Difficult Much Slow Low Return on investment Leverage Liquidity Capital required versus capital available Cash flow Ease of exit from market Risk involved in business Inventory turnover Economies of scale and experience 0 1 2 3 4 5 6 0 1 2 3 4 5 6 0 1 2 3 4 5 6 0 1 2 3 4 5 6 0 1 2 3 4 5 6 0 1 2 3 4 5 6 0 1 2 3 4 5 6 0 1 2 3 4 5 6 0 1 2 3 4 5 6 High Balanced Solid Low High Easy Little Fast High Note : R = Relative importance of factor C = Chance of sustaining E = Combined effect
Strategic Options and Generic Strategies Status Quo Concentric Diversification FS Conglomerate Diversification Concentration Overall Cost Leadership Focus Diversification Vertical Integration Conservative Aggressive CA IS Divestment Defensive Concentric Merger Differentiation Gamesmanship Competitive Liquidation Conglomerate Merger ES Retrenchment Turnaround ( FS = financial strength of the company; IS = industrial strength; ES = environmental stability; CA = competitive advantage of the company )
In order to enhance the use of SPACE (Strategic Position and Action Evaluation), two items: the relative importance of each factor (R) and the chance of sustaining the importance level of the factor (C) are added. A combined effect (E) is obtained by multiplying these two items. The ranges of total value for E is approximately 0 to 50. Total E Value Expectancy 0 - 10 10 - 20 20 - 30 30 - 40 40 - 50 above low low/moderate moderate moderate/high high very high The total E values indicate that the likelihood of maintaining a given factor is as shown above, whereas a basic SPACE analysis assumes they will continue at the current level in the future.