Download
1 / 27
420 likes | 910 Vues
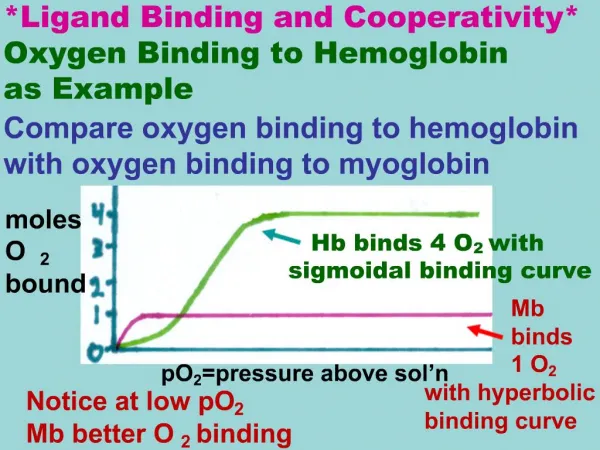
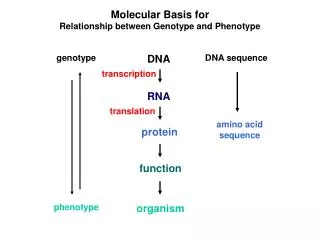
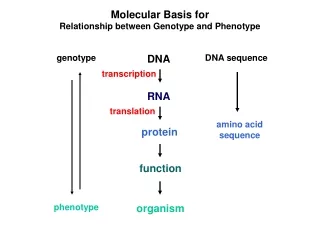
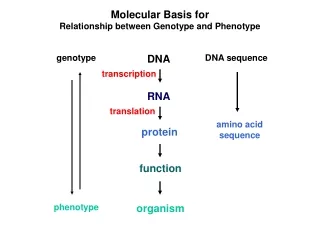
Ligand Binding Basis for enzyme specificity and molecular recognition. A case where a single ligand (L) binds to a single receptor (R). [L] and [R] are concentrations of free L and free R. [LR] is the concentration of the complex.

E N D
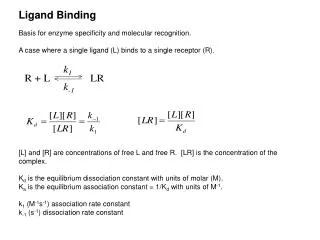
Ligand Binding Basis for enzyme specificity and molecular recognition. A case where a single ligand (L) binds to a single receptor (R). [L] and [R] are concentrations of free L and free R. [LR] is the concentration of the complex. Kd is the equilibrium dissociation constant with units of molar (M). Ka is the equilibrium association constant = 1/Kd with units of M-1. k1 (M-1s-1) association rate constant k-1 (s-1) dissociation rate constant
Free energy of interaction The free energy change on binding a ligand to its receptor can be calculated from the Kd or Ka G0 = -RT ln (Ka) = RT ln (Kd). More negative the G0 the stronger the binding.
Derivation of single binding equilibrium The fraction of bound protein = moles of ligand bound per mole of protein = X
[dTTP*-protein]uM dTTPs bound per hexamer = [hexamer]
Hepatitis C virus helicase protein 4 W, 17 Y protein DNA Minimal DNA binding site? Free energies of interactions? cooperativity in binding?
The fluorescence of NS3h protein was measured in the presence of different amounts of a 10-nt long ssDNA substrate. The fluorescence signal was corrected for dilution and inner filter effect and fit into Equations 2-4 to obtain n and Kd (n = 0.91 0.02, Kd = 7.4 0.7 nM).