Calcium Dynamics in Neurons: Diffusion, Buffering, and Cellular Homeostasis
360 likes | 471 Vues
This paper explores the mechanics of calcium (Ca2+) dynamics in neuronal cells. It discusses the diffusion rates of Ca2+ through axons and how various buffering mechanisms and binding interactions influence these rates. Key findings reveal that the effective diffusion constant for Ca2+ in axons is lower than in water, indicating the impact of cellular environments on ion transport. The work analyzes the role of calcium in signaling and the implications for cellular responses such as exocytosis and gene expression, underscoring the importance of homeostasis in neuronal function.

Calcium Dynamics in Neurons: Diffusion, Buffering, and Cellular Homeostasis
E N D
Presentation Transcript
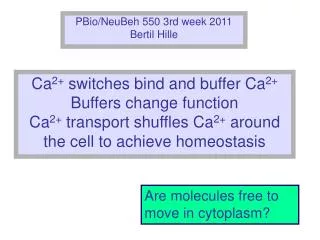
PBio/NeuBeh 550 3rd week 2011 Bertil Hille Ca2+ switches bind and buffer Ca2+ Buffers change function Ca2+ transport shuffles Ca2+ around the cell to achieve homeostasis Are molecules free to move in cytoplasm?
H-K meth blue How fast do molecules diffuse in axons? before 3 s 20 s 120 s 600 s 700 mm Methylene blue is injected into a squid axon along its axis. 15 s After injection, spread of dye in one dimension (r) would follow the Einstein equation approximately ("bell-shaped" Gaussian distribution): C(x,t) = Const. * (1/t) * exp –(r2/2Dt) SD = = sqrt(2Dt) From this and dye data: find that D for a dye in axon is 1.5*10–6 cm2/s, compared to 4*10–6 cm2/s for dye in water. (Hodgkin & Keynes, 1956) Generalization: In cells D is typically ½ of free-solution value and Gcyto= Gext / 2
H-K Ca45 spread 45Ca2+ diffusion in axons Hodgkin & Keynes, 1957 14 min axon 478 min –4 –2 0 2 4 6 distance r (mm) 45Ca2+ is injected into a short stretch of axon and its longitudinal diffusion gives an effective diffusion constant C(x,t) = Const. * (1/t) * exp –(r2/2Dt) DCa in axon = ~0.4*10–6cm2/s compared to 6*10–6 cm2/s in water.
Difffsion w. binding Clearance is slowed too Binding slows diffusion DCa DCa DCa DCa DCa Caf(1) k Cabound = k Caf(1) immobile Caf(2) k Cabound = k Caf(2) immobile Caf(3) k Cabound = k Caf(3) immobile Caf(4) k Cabound = k Caf(4) immobile k is the "calcium binding ratio" Free particles diffuse at their normal free rate DCa, but the whole population diffuses more slowly. The population diffuses at a rate DCa/(1 + k), if the bound complex can't move, or, more generally: Dfree + kmobile * Dbound,mobile (1 + kmobile + kimmobile)
Interlude for discussing Augustine/Neher paper Discussion of Neher/Augustine paper"Calcium gradients and buffers in bovine chromaffin cells"Each figure will be fully described by a student--as if you are teaching it to us for the first time. Further questions will come from the audience. Purpose of paper Bertil Fig. 4 & 5 Jennifer Deem Fig. 6 Wucheng Tao Fig. 7 Curtis Easton Fig. 8 Merle Gilbert Fig. 9 Aaron Williams
AN4 100 ms 300 ms 500 ms 1,000 ms after end 10,000 ms after end Fig 4 Jennifer Deem
AN5 rest level Fig 5 Jennifer Deem
Diffusion into a sphere of radius r Crank in sphere x = 0, center of sphere x = r, edge of sphere Modeled times are given in multiples of the diffusional characteristic time: r2 / D For example, if a cell has radius r = 9 mm and the free diffusion coefficient is 4 * 10–6 cm2/s as for small ions. Then r2/D is 20 ms, and for the red curve labeled 0.15: t = 0.15 r2/D = 0.15x20 ms corresponds to 3 ms. 0.15 distance from center of sphere (Crank, The Mathematics of Diffusion, Oxford, 1956) see also Carslaw & Jaeger, The Conduction of Heat in Solids, Oxford
AN & Crank Rough guesstimate of Ca2+ diffusion rate Since Ca takes perhaps 50-100 ms instead of 3 ms to reach the 0.15 curve, it might be ~30 times less mobile than free Ca in this chromaffin cell experiment with EGTA & fura.
AN6 500 ms Fura rest level Fig. 6 Wucheng Tao
Fig 7 Curtis Easton AN7 Fura 250 ms ICa Fura 500 ms
Indo Binding Ratio Binding ratios depend on indo and Ca concentrations as well as endogenous buffer Ca bound to indo = cindo/(1+Kindo/Cai) suppose endogenous k = 100, then added indo-1 increases k above 100 k = 100+ (cindo/Kindo)/(1+Cai/Kindo)2 600 mM 300 Kindo ~ 200 nM Differential Ca binding ratio (k) 500 mM 200 400 mM of added indo-1 100 0 mM [Ca2+]i (mM)
AN8 Fig 8 Merle Gilbert 400 uM fura-2 t = 190 s Inset back to 50 uM fura-2
AN9 ? ? (seconds) decay (s) 7 s -89 Fura-2 Ca binding ratio (kB) Fig 9 Aaron Williams
Conclusions Part 1: Binding = buffering = sensing Buffering reduces Ca2+ changes, Slows Ca2+ changes, Slows diffusion, Shortens local spikes of Ca2+ Now: Ca2+ transport Clearance mechanisms
Ca2+ fluxes in an excitable cell Typical Ca2+ fluxes in a non-excitable cell Inputs: hormones, cytokines, growth factors, antigens PIP2 Agonist Na+-Ca2+ exchanger R DAG Gq PLC IP3 Ca2+ Ca2+ Ca2+ IP3R channel Na+ SERCA pump ATP ER Plasma membrane Ca2+ ATP Ca2+ H+ Mito PM Ca2+ ATPase SOC/CRAC channel Ca2+ Na+ Responses: Fluid secretion, exocytosis, channel gating, enzyme activities, cell division, proliferation, gene expression
Anterior pituitary control by portal peptide factors Hypothalamus Brain rostral Blood testosterone (-) inhibin (-) activin (+) Posterior pituitary Anterior pituitary
GonadoModel Activation of a pituitary gonadotrope GnRH GnRHR Gq PLC DAG PLC IP3 ER IP3R LH FSH Ca2+ LH FSH Mitoch. LH FSH Ca K(Ca) exocytosis
GnRHOscill93 GnRH makes Ca2+ and IK(Ca) oscillate gonadotrope loaded with 50 M indo1 GnRH I K(Ca) 100 IK(Ca) (pA) 0 2 [Ca2+] [Ca2+]i (mM) 0 0 100 200 300 Time (s) (Tse & Hille, 1992)
GonadoCaFree Ca2+ influx is not required hormone-activated gonadotrope loaded with 50 M indo1 0.8 0 Ca2+ (EGTA) 0.4 [Ca2+]i (mM) 0 0 100 200 300 400 Time (s) (Tse & Hille, 1992)
Ca2+ oscillations need the SERCA pump pituitary gonadotroph 2 nM GnRH 1.5 Ca2+ ER 10 M BHQ 1 [Ca2+]i (mM) 0.5 0 0 200 400 Time (s) BHQ, a readily reversible blocker of SERCA pumps arrests Ca2+ oscillations at the cytoplasmic high-Ca2+ level. (Tse, Tse, Hille, PNAS, 1994)
GonadoModel Activation of a pituitary gonadotrope Focus on ER for a moment GnRH GnRHR Gq PLC DAG PLC IP3 ER IP3R LH FSH Ca2+ LH FSH Mitoch. LH FSH Ca K(Ca) exocytosis
SeeingStores Visualizing stores with mag-indo1 gonadotrope loaded with mag-indo1-AM, a low-affinity dye Before breakthrough After breakthrough + Mn2+ Bright field Fluorescence 30 s 60 s 60 s digitally enhanced (Tse & Hille, 1992)
GnadoMagIndo Cyclic release and refilling of Ca2+ stores [Ca2+]er IK(Ca) 60 35 [Ca2+]er [Ca2+]er (mM) [Ca2+]er (mM) 20 GnRH 32 200 225 250 IK(Ca) Time (s) gonadotrope loaded with mag-indo1, a low-affinity dye 0 500 Time (s) (Tse, Tse & Hille, 1994)
Ca2+ fluxes in an excitable cell Typical Ca2+ fluxes in a non-excitable cell Inputs: hormones, cytokines, growth factors, antigens PIP2 Agonist Na+-Ca2+ exchanger R DAG Gq PLC IP3 Ca2+ Ca2+ Ca2+ IP3R channel Na+ SERCA pump ATP ER Plasma membrane Ca2+ H+ ATP Ca2+ Mito PM Ca2+ ATPase SOC/CRAC channel Ca2+ Na+ Responses: Fluid secretion, exocytosis, channel gating, enzyme activities, cell division, proliferation, gene expression
GonadoLogCaDecay94 Ca2+ decays nonexponentially gonadotrope loaded with 25 M indo1 1000 Focus on mitochondria for a moment 100 D[Ca2+]i (mM) large Ca2+ load 10 small Ca2+ load 0 10 20 30 40 Time (s) (Tse, Tse & Hille, 1994)
ChromCCCP Rate of fall is a measure of rate of Ca clearance from cytoplasm without mitochondrial uptake Mitochondrial Ca2+ clearance dominates in chromaffin cells chromaffin cell loaded with indo1 CCCP collapses proton motive force 2 CCCP [Ca2+]i (mM) 1 control 0 0 60 120 Time (s) A 1-s depolarization loads cell with calcium. Clearance then begins. (Herrington, Park, Babcock, Hille, 1996)
ChromCCCP2 Mitochondria store Ca2+ for a while, CCCP lets it out 3 chromaffin cell loaded with indo1 CCCP stops uptake into mitochondria 2 CCCP1 [Ca2+]i (mM) Can we "see" Ca2+ in mitochondria? 1 CCCP2 CCCP1 0 CCCP2 0 30 60 90 120 Time (s) A 1-s depolarization loads cell with calcium. Clearance then begins. (Herrington, Park, Babcock, Hille, 1996)
ChromDeconv96 Cationic rhod-2 accumulates in mitochondria chromaffin cell loaded with rhod-2 KCl wash 14 mm deconvolution microscopy (Babcock, Herrington, Goodwin, Park, Hille, 1997)
ChromRhod2 Mitochondria pump Ca2+ back to cytoplasm chromaffin cell loaded with rhod-2-AM and calcium green in pipette 1.0 0.6 0.4 mito. (rhod-2) [Ca2+]m (mM) [Ca2+]c (mM) 0.5 cyto. (CG) 0.2 0 0 0 100 200 300 Time (s) (Babcock, Herrington, Goodwin, Park, Hille, 1997)
ChromRhod2A Rhod-2 is reporting mitochondrial Ca2+ chromaffin cell loaded with rhod-2 AM and calcium green rhod2 mitochondria 0.5 [Ca2+]m (mM) CCCP 0.1 1.0 calcium green cytoplasm 0.5 [Ca2+]c (mM) 200 s 0 oligomycin (Babcock, Herrington, Goodwin, Park, Hille, 1997)
ChromRates Ca2+ transporter rates in chromaffin cells 60 These rates are calculated from slopes of [Ca] decay after a Ca load, multiplied by the cytoplasmic Ca binding ratio, to yield the actual moles crossing cell membranes. mitochondria 40 Transport rate (bound + free) (mM/s) 20 rest pmCa-ATPase NCX 0 0 0.5 1.0 1.5 free [Ca2+]c (mM) (Herrington, Park, Babcock, Hille, 1996)
3 clearance Ca2+ clearance rates for three cell types pancreatic beta cell spermatozoon chromaffin cell 80 total 60 60 mito SERCA 40 40 2 Transport rate (mM/s) total PMCA NCX 1 20 20 NCX PMCA PMCA mito NCX 0 0 0 0 1.0 0 1 2 0 1.0 [Ca2+]c (mM) [Ca2+]c (mM) [Ca2+]c (mM) Babcock/Herrington Chen/Koh Wennemuth
Comparison of transport rates in different cell types Rates of [Ca2+]i fall (nM/s) @ 1000 nM Ca2+
GonadoModel Buffers of a pituitary gonadotrope GnRH GnRHR Gq PLC DAG PLC IP3 ER IP3R LH FSH Ca2+ LH FSH Mitoch. LH FSH Ca K(Ca) exocytosis
GonadoCaBookkeep Calculating Ca2+ binding ratios cytosol ER stores mitochondria Approx. volume 1 0.1 0.06 D free (mM) 1 10 0.4 D bound (mM) 100 1000 1700 ratio bound/free(k) 100 100 4000 calmodulin chaperones proteins??? calretinin calreticulin PO4 calbindin calnexin phospholipid? parvalbumin BIP annexins calsequestrin Candidate buffers: The calculations come from experiments with gonadotropes and chromaffin cells