Download
1 / 21
210 likes | 490 Vues
From raw data to easily understood gender statistics. Workshop on Integrating a Gender Perspective into National Statistics, Kampala, Uganda 4 - 7 December 2012 Ionica Berevoescu Consultant United Nations Statistics Division. Re-cap from previous days.

E N D
From raw data to easily understood gender statistics Workshop on Integrating a Gender Perspective into National Statistics, Kampala, Uganda 4 - 7 December 2012 Ionica Berevoescu Consultant United Nations Statistics Division
Re-cap from previous days Sex = a biological individual characteristic recorded during data collection in censuses, surveys or administrative sources + Demographic, social and economic characteristics Gender issues = questions, problems and concerns related all aspects of women’s and men’s lives, including their specific needs, opportunities, or contributions to society Data disaggregated by sex Gender-sensitive methods of data collection Analysis of data and /or qualitative information Gender statistics Gender inequalities Gender = A social construct. Refers to socially-constructed differences in attributes and opportunities associated with being female or male and to the social interactions and relationships between women and men
Basic table for analysis of gender statistics (1) • Distribution of each sex by selected characteristic (distribution of women and men by economic activity status): • Women and men totals are used as denominators, proportions calculated by columns • Used for comparison of women and men with regard to the characteristic; and the basis for many gender indicators • The basis for calculating gender gap: the proportion of women employed is lower than the proportion of men employed by 34 percentage points Proportion employed Economic activity status for population 15-64 years old, Peru, 2007 Source: United Nations Statistics Division, DYB, Census Data Sets
Basic table for analysis of gender statistics (2) • Sex distribution within the categories of a characteristic • Categories of the characteristics are used as denominators; proportions are calculated by raw. • Used to show the under- or over-representation of women or men in selected population groups and it works as long as the sex distribution is not near the 50%. • Most often utilized for selected groups where women represent a minority, such as parliamentarians, managers, mayors, or researchers. Economic activity status for population 15-64 years old, Peru, 2007 Source: United Nations Statistics Division, DYB, Census Data Sets
Presentation of gender statistics in graphs Graphs • Summarize trends, patterns and relationships between variables. • Illustrate and amplify the main messages of the publication, and inspire the reader to continue reading. • Are generally better understood and interpreted by the average reader, and therefore appeal to a wider audience. Every graph should make a point and that point may be given in the title. Nevertheless, in many publications, titles state the subject and the coverage of data in the graph. In this case, the title should start with the key word(s) of the statistics presented.
Line charts • Give a clear picture of changes over time or over age cohorts. • Other examples: literacy rates over time, labour force participation rates over time • Generally recommended to start from zero at the y-axis of a quantitative variable, however, in this case, starting from age 35 facilitates the comparison of women’s and men’s trends. • Design note: only one type of gridline used Life expectancy at birth by sex, South Africa, 1950-2010 Source: United Nations, 2011.
Line charts (cont’d) A graph can summarize trends and patterns that cannot easily be discovered in data tables. In the example given, three points are made: • At all ages, labour force participation rates are lower for women than for men • In the last two decades women’s participation rates increased. The same was not observed for men. • In the most recent year observed, women tend to withdraw from the labour market after age 30 Labour force participation rate by age group, by sex, Chile, 1990 and 2008 Source: ILO, LABORSTA.
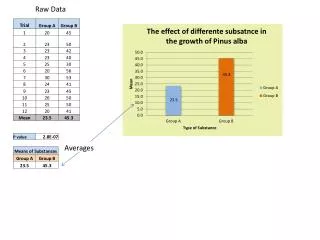
Vertical bar charts • Bar charts are common in presentation of gender statistics • Simple bar charts are suitable for indicators such as • total fertility rate by region, • antenatal care by urban/rural areas, • proportion of women married before age 18 by level of education. • Design notes: • Ticks are not necessary on the axis representing a qualitative variable • Adding 3-D visual effect will not change the main story, but it will make the graph unnecessarily complicated and misleading Simple bar charts Women aged 15-49 who have experienced physical violence since age 15 by wealth quintiles, India, 2005-06 Source: India Ministry of Health and Family Welfare, Government of India, 2007.
Vertical bar charts (cont’d) Grouped (or clustered) bar charts • In gender statistics, women and men are shown as two sets of differently colored bars side by side within each category, so that the status of women is easily compared with the status of men. • Design note: labels for values presented in the graph have been removed not to distract the viewer from the main message: gender gap in school attendance is considerably higher in the poorest quintile Primary school net attendance rate for children in the poorest and wealthiest quintiles, by sex, Yemen, 2006 Source: Yemen Ministry of Health and Population, and UNICEF, 2008
Dot charts • If grouped bars are needed and more data points have to be illustrated, the bars can become too thin and difficult to interpret. • use dot charts • Design notes: • This presentation highlights even more the gender gap • The gender-blind total has been removed from the graph to keep the attention on the gender gap Primary school net attendance rate for girls and boys by wealth quintile and by urban/rural areas Yemen, 2006 Source: Yemen Ministry of Health and Population, and UNICEF, 2008
Stacked bar charts • Most effective for categories adding up to 100 per cent. • Design note: Category/categories of most interest should be placed at the bottom to facilitate the comparison. • Common problems: • more than three segments of the bar are difficult to compare from one bar to another • One or more categories may be too short to be visible on the scale Property titles by sex of the owner and urban/rural areas, Viet Nam, 2006 Source: Viet Nam Ministry of Culture, Sports, Tourism and others, 2008.
Stacked bar charts (cont’d) • Often used to illustrate the percentage distribution by sex within various categories of variables, such as share of women and men among categories of occupation; or the distribution of a variable within the female and male population (see example) Employment by sector, by sex, Morocco, 2008 Source: ILO-KILM.
Horizontal bar charts Time spent on care for children, sick and elderly by sex, urban/rural areas and marital status, Pakistan, 2007 (minutes per day in total population aged 10 and above) • Considered when many categories need to be presented, or where categories presented have long labels. • Horizontal bar charts may be preferred for showing some type of time use data, because the left-to-right motion on the x-axis generally implies the passage of time • Design notes: • women and men are presented side by side within each category, so that the main comparison is between women and men • Categories of marital status are displayed in order of stages of the life cycle Source: Government of Pakistan, Federal Bureau of Statistics, 2009
Pie charts • Suitable for illustrating percentage distribution of qualitative variables. • An alternative to the bar charts • Common error: too many categories • Best used when only one or two shares of the whole are shown for different years, different groups or different related categories Women married before age 18 in urban and rural areas, Gambia, 2005-06 (per cent) Source: The Gambia MICS 2005-06 Report
Scatter plots School attendance rates for 6-17 years old by sex and state, India, 2005-06 • Used to show the relationship between two variables • Useful when many data points need to be explained, such as in the case of a large number of regions or sub-regions of a country • Design note: the four states where girls have significantly lower school attendance rates than boys have been highlighted. Source: India Ministry of Health and Family Welfare, Government of India, 2007
Presentation of gender statistics in tables Tables • They may not have the appeal of graphs, but are necessary forms of presentation of data. • Types of tables: • Large comprehensive tables, often placed in the annex of the publication (Annex Tables). • Text tables: smaller tables that are referred to and are part of the main text in the publication. Needed as support for a point made in the text. • Text tables are always a better alternative than presenting many numbers in a text, making the explanation more concise. • As with the graphs, the selection of the data to be presented in small tables depends on the findings of analysis in terms of most striking differences or similarities between women and men. • Some of the data that need to be presented may be easier conveyed in a table than in a graph (see next examples). • When data do not vary much across categories of a characteristic… • … or they vary too much
List tables • Tables with only one column of data • Can be used, for example, to present data with not much variation between categories. States with lowest proportions of women aged 15-19 who have had a live birth, India, 2005-06 Source: India Ministry of Health and Family Welfare, Government of India, 2007
Tables with two or more columns • Can be used when the values observed for some categories vary extremely compared to the rest of categories • Design notes to facilitate the comparison between women and men: • Data are rounded to integers • The gender-blind total was deleted Adult crude death rates by cause of death, South Africa, 2008. Selected top causes of death Source: WHO, Global burden of disease 2008; online database
Tables with two or more columns (cont’d) • Can be used as a form of presentation when the focus of analysis is a breakdown variable (education of mother in the example below) that is associated with a number of related indicators expressed in different units Demographic indicators by mother’s number years of schooling, India, 2005-06 Source: India Ministry of Health and Family Welfare, Government of India, 2007
User friendly presentations of gender statistics - summary • Women and men should be presented side by side to facilitate comparisons. • Women should always be presented before men. • The words women/men and girls/boys should be used instead of females and males whenever possible. • When data are presented to a broader audience, numbers should be rounded to 1,000, 100 or 10 and percentages to integers, to facilitate the comparison between women and men • The gender-blind total should be deleted in tables and graphs to facilitate comparisons between women and men.
User friendly presentations of gender statistics - summary (cont’d) • Charts that give clear, visual information should be used instead of tables whenever possible. • Too many categories should be avoided in pie charts and stacked bars. • Use the same color for women and the same color for men along all charts • Preference should always be given to a simple layout in designing charts: • Only one type of gridline, either vertical or horizontal should be used, or not at all; • Ticks are not necessary on the axis representing a qualitative variable; • Labels for values presented inside a graph are, in general, distracting and redundant; • Graphs with a third unnecessary dimension are misleading.