Perspectives on the Future What exactly is doomed ?
590 likes | 735 Vues
Perspectives on the Future What exactly is doomed ?. Bob Lloyd Energy Studies. Cheer up Christchurch. ☺. If you think its bad here it is likely to get much worse elsewhere. What is not doomed?. The future is not doomed, time will not stop.

Perspectives on the Future What exactly is doomed ?
E N D
Presentation Transcript
Perspectives on the Future What exactly is doomed ? • Bob Lloyd • Energy Studies
Cheer up Christchurch ☺ If you think its bad here it is likely to get much worse elsewhere
What is not doomed? • The future is not doomed, time will not stop. • The earth is not doomed, at least not for a billion years or so. • Humanity is probably not doomed; even James Lovelock talks of a few breeding pairs surviving in Antarctica.
What may be doomed ? • The world’s physical resources, especially energy are reaching limits • The existing biosphere is degrading • Many people in fragile and marginal environments are doomed: they are already dying • Resource wars are dooming more people • Many species are doomed: they are currently becoming extinct at an alarming rate • Many freshwater supplies are degrading • Fertile soils are degrading • Our economic system and world’s fixation on growth, wealth and GDP are doomed: they cannot survive a declining world energy supply
In Doomsaying Timing is everything Prominent doomers who got the timing wrong • Malthus ( 200 years ago) • Paul Erlich (v Julian Simon • Meadows et al Club of Rome report 1972
Physical Resources reaching limits (Energy) • Fossil fuels • Oil • Coal • Gas • Nuclear • Renewables can they save us?
Oil data to June 2011 Oil consumption is flat lining Oil Drum 2011
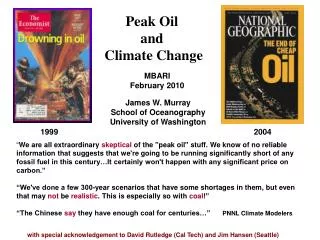
IEA on Peak Oil 28th April 2011 • FatihBirol - Chief Economist IEA interviewed on Australian Television recently
Peak oil is not synchronous • Developing countries are generally still increasing consumption • Developed countries are static or decreasing
OIL - Colin Campbell’s latest scenario puts peak oil (all liquids) at 2010: GAS a decade later in 2020 GAS 2020 OIL 2010 Colin’s EUR for conventional oil = 1.9T bbls All liquids 2.5T bbls
What about coal? There must be lots of coal everyone says so !
But coal reserve data is old and dated A similar analysis to peak oil analysis was carried out by the German “Energy Watch Group” and they found peak coal could come as early as 2025 :albeit with a relatively flat plateau 2025
Padzek and Croft predict peak coal in 2011 using a multicycleHubbert analysis: Energy Policy 2010
More realistic study by MinqiLi University of Utah Predicts peak coal for China AND the ROW by 2027 – Oil Drum July 2011
What about Climate change? The earth is warming and the culprit is CO2
Climate ChangeCurrent June 2011 CO2 is 393.7 ppmSafe levels450ppm CO2e IPCCJim Hansen 350 ppm CO2
According to Jim Hansen the safe level of CO2 of 350 ppm is only possible if … 1. No coal used after 2030 All coal emissions halted in 19 years 2. No Unconventional Fossil Fuels Tar sands, Oil shale, Methane hydrates 3. Only conventional oil used NO Polar regions, Deep ocean, Pristine land, No deep ocean oil off NZ
Tipping points and runaway climate change once temperatures go above 2 o C
Current effects • Fires in Russia • Floods in Australia, Pakistan, China .... • Tornados, Twisters and Hurricanes in various places • Famines in East Africa • Droughts various
Back to energy:What about Nuclear? (Presently 6% of world energy supply from around 450 reactors) FUKUSHIMA 2011 Maybe not
PV transition model for world electricity supply can solar replace fossil fuels ? • Pessimistic and Optimistic embodied energy parameters for arrays ranging from 7000 MJ/m2 to 1750 MJ/m2 • Solar radiation either mid European or southern European • Mineral resources needed cf world resources • Costs ranging from $1/W to $4/W installed • Limits of 10% of world electricity, flags % of resources • Land area limit of 1% of world land area or 1.5 million km2cf area NZ 270,000 km2 • Electricity growth rates ranging from BAU (2.4% pa) through steady state to collapse situations
Conclusions from the model • The transition to renewables of our present world electricity supply is technically feasible • It would require considerable resources including up to 10% of world electricity supply pa to make the devices and around 10% of world GDP pa BUT • Material constraints would eventually prevail, however, if we want growth beyond the middle of this century
Gail the Actuary on Debt See Gail Tvberg http://www.theoildrum.com/node/6191
Why we need growth? • The world economy need growth to keep people employed • The financial system needs growth to pay back debt and for interest payments • The third world needs growth just to survive
BUT continuous growth is physically impossible – 2.3% pa increase in energy use leads to the following: Madness Murphy exclaims! Tom Murphy Oil Drum
Highly non linear effects • Originate because the world financial system is predicated on growth • Including our fractional reserve banking system • Debt and interest • Are all essentially a Ponzi scheme • Once growth falters then the system is liable to non linear contraction
Report conclusions • When considering the consequences of peak oil, no everyday experiences and only few historical parallels are at hand. It is therefore difficult to imagine how significant the effects of being gradually deprived of one of our civilisation’s most important energy sources will be. • Psychological barriers cause indisputable facts to be blanked out and lead to almost instinctively refusing to look into this difficult subject in detail.
What will happen to oil prices ? • Sadad Al Husseini ASPO 2009 Denver “there is a ceiling to what the global economy can afford for energy. Roughly speaking, once you get to five to six percent of the global GDP being spent on oil, that’s about the ceiling” • Implications oil price cannot go much above US$120 / barrel
Linear v non linear interactions • Linear: Hirsh - oil declines at 1% pa transport declines at 1% pa. world GDP declines at 1% pa. • Economists like linear interactions as they are more tractable • Highly Non linear: oil declines at 1% pa world economy collapses as financial system cannot work with negative growth (Knightian, Taleb: Black Swans) • Highly Non linear interactions needs systems dynamics modelling and even then chaotic systems cannot easily be modelled
Back to NZ • Is NZ ready for Peak Oil ? • It will depend on whether the predominant outcomes are linear or non linear and on the rates of decline of oil production
Risk analysis: 4 scenarios • Optimistic: oil decline rate 0.6% pa until 2030 • Pessimistic: oil decline rate 4% pa • World economy reaction: linear • World economy reaction: non linear
Linear 0.6% decrease pa • Efficiency gains and transport reorganization could mitigate crude oil declines with little adverse effects until around 2030 by which time either climate change difficulties or gas declines and coal peaking are likely to have triggered non linear responses.
Linear, 4% decrease pa • Efficiency gains could mitigate crude oil declines until around 2015 - 2020 depending on when the declines start. China and developing economies will be stressed by lack of petroleum supplies to fund further growth and the collapse of the world factory, among other problems, including climate change, are likely to trigger non linear responses elsewhere.
Highly Non linear, 0.6% decrease • Oil supply decline will trigger a slowdown in world economies and the world will move to a period of stagnating recession alternating with periods of recovery. • Evidence for this scenario has already appeared. • What follows is likely to be a series of peaks and downturns in the world economy as the non linear interaction unfolds and the world adjust to a declining oil supply.