Download
1 / 17
170 likes | 290 Vues
VISDA (Visual Statistical Data Analyzer) is a cutting-edge analytical tool developed for cluster modeling, visualization, and data discovery within the caBIG framework. It employs a hierarchical mixture of Gaussian kernels for adaptive cluster validation, enabling users to visualize clustered data through rich discriminative projections. With features such as supervised and unsupervised feature selection, PCA, and "soft" clustering techniques, VISDA supports multiple data formats and offers advanced parameter estimation through EM algorithms. Perfect for researchers seeking to uncover hidden data patterns and improve data analysis processes.

E N D
caBIG-ICR - VISDA VT –GU Developer Team: Huai Li, Jiajing Wang, Yue Wang, Jianhua Xuan, Robert Clarke UPenn – The Wistar Institute Adopter Team: Louise Showe, Michael Showe, Malik Yousef, Hsiuan-Lin Wu,and Michael Nebozhyn
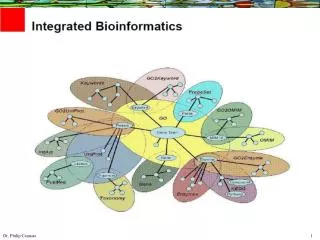
VISDA Overview VISDA (VIsual Statistical Data Analyzer)is a caBIG-TM analytical tool for cluster modeling, visualization, and discovery • Model clustered data structure via hierarchical mixture of Gaussian kernels (adaptive with cluster validation) • Visualize data clusters via discriminative projections incorporating human gift for pattern recognition • Discover and display hidden data clusters via top-down“soft” clustering (hierarchical yet exploratory)
Supported Data File Support data retrieving from caArray Support local MAGE-ML file format Support tab-delimited data file with multiple gene annotations as well as multiple sample annotations Analytical Algorithms Support sample clustering and gene clustering Has supervised/unsupervised feature selection Has PCA and PPM projections Has hierarchical statistical modeling and parameter estimation by EM algorithm Has advanced options for DCA projection and MDL cluster validation VISDA-caBIGTM Key Features
GUI Main frame has a history tracking panel as well as a working view panel. Analysis node and Dataset node can be created and deleted from the tree. Input file can also have multiple rows for different sample annotation. User has the option to choose one of the rows as label information for analysis. Tables of the selected genes for phenotype clustering and their performances can be viewed, and saved. Has the three types of 2D-projection visualization. Figures can be viewed, zoomed, and saved as PNG or EPS format. Support sample/gene annotation view. Support cluster visualization by hierarchical display History log can be viewed and saved VISDA-caBIGTM Key Features
Installation http://gforge.nci.nih.gov/frs/download.php/320/visda-Deploy-V1.0.rar http://cabigcvs.nci.nih.gov/viewcvs/viewcvs.cgi/visda/VISDA-Developer/Month-12-yr1/visda-SourceCode-V1.0.rar
VISDA Silver Compatibility • VISDA can retrieve data from caArray (can be considered as one caGrid node) by utilizing MAGE-OM APIs. • MAGE-OM CDEs (registered in caDSR) used in VISDA are documented. • Analysis results got from VISDA are the selected feature set, the "soft-clustering" probabilities of the samples/genes in each cluster and the hierarchical "tree of phenotype" or "tree of gene module" plots which are retained locally. • Well documented VISDA APIs. • UML documentation of all VISDA components using Enterprise Architect (EA).
VISDA UML Class Diagram • edu.vt.cbil.visda
VISDA UML Class Diagram • edu.vt.cbil.visda.data
VISDA UML Class Diagram • edu.vt.cbil.visda.comp
VISDA UML Class Diagram • edu.vt.cbil.visda.view