Download
1 / 20
210 likes | 364 Vues
Measurement of the Charge of an Electron. Presented by John Cole Experiment Conducted by John Cole, Sarmadi Almecki, and Pirouz Shamszad. Abstract. Theory. Fundamental Charge Townsend Millikan’s Oil Drop Experiment. I c = A[e qV b /kT –1]. I c = collector current q = charge (eV)

E N D
Measurement of the Charge of an Electron Presented by John Cole Experiment Conducted by John Cole, Sarmadi Almecki, and Pirouz Shamszad
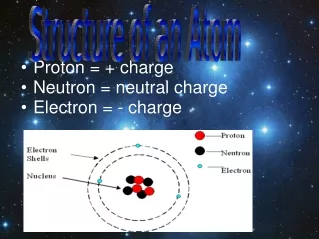
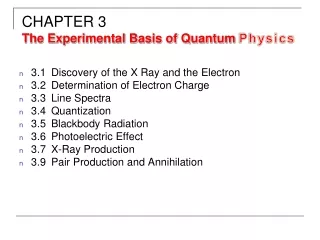
Theory • Fundamental Charge • Townsend • Millikan’s Oil Drop Experiment
Ic = A[eqVb/kT –1] Ic = collector current q = charge (eV) Vb = base voltage of the transistor K = Boltzman’s Constant (8.617 342 x 10-5 eV K-1) T= temperature in Kelvins Transistor Theory
V = I R V = voltage (eV) I = current (amps) R = resistance (ohms) Ohm’s Law
Vrc = BeqVb/kT Approximates for the specific voltage greater than 1/40 V Combining the Equations
Experimental Setup • NPN transistor 2N3904 • 2 10 turn potentiometer • Voltage source • Voltmeter (base) • Voltmeter (rc) • Resistors
Experimental Setup • Temperature was varied in the second part using a heat pump & • refrigeration device. • Transistor leads were extended so that it could be remotely • placed in the temperature controlling device. • Mercury thermometer monitored temperature
Procedure Part I Constant Temperature, Varying Voltage • Voltage was varied using the potentiometer • Data was recorded at 294.15K
Procedure Part II Constant Voltage, Varying Temperature • Temperature was adjusted via heat pump / refrigerator • Data was recorded T
Part I: Varying Potential Log Scale • Logarithmic Scale plotted using gnuplot software
Interpretation: Part I • Slope value found using method of least squares • Slop value = 31.1452 +/- 1.03 • Using the equation Vrc = BeqVb/kT • Slope = q/kt • k and t are constants, solved for q Fundamental Charge of an Electron 1.2648 e-19 C +/- 4.18 e-21 C
Interpretation: Part II • Slope found using method of least squares • Value of 6411.11 +/- 247.8 • slope = qVb/k Fundamental Charge of an Electron 1.7703 e-19 C +/- 6.842 e-21 C
Error • Voltmeters • Vc = 1/100 V • Vb = 1/1000 V • Thermometer • Single Degree Accuracy • Resistor • }} accurate to only 2% • Statistical Limitations • limited data
Conclusion Part I : 1.2648 e-19 C +/- 4.18 e-21 C Part II: 1.7703 e-19 C +/- 6.842 e-21 C Average 1.3175 e-19C +/- 5.511e-21C
Improvement • More Accurate Equipment • More independent sets of data for statistical improvement • Different Transistors • Attention to detail in circuit construction