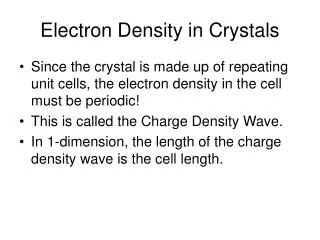
Understanding Electron Charge Density
Understanding Electron Charge Density. Experimenting with Quantum Theory. Procedure. Drop 100 darts/marbles on a target Analyze the data. Analysis. Conclusion Questions: . a. For each ring, plot number of hits on y-axis against average distance on x-axis. Connect to 0,0.

Understanding Electron Charge Density
E N D
Presentation Transcript
Understanding Electron ChargeDensity Experimenting with Quantum Theory
Procedure • Drop 100 darts/marbles on a target • Analyze the data
Conclusion Questions: • a. For each ring, plot number of hits on y-axis against average distance on x-axis. Connect to 0,0. b. Graph 1a curve represents the hit probability as a function of the average radius of ring. What is the probability a dart will hit in ring 4? From your graph, at what distance from the bullseye will a dart be most likely to hit? c. Compare this curve to the electron probability curve in figure 15-2a. State what the graph in 15-2a tells us about the electron. 2. a. graph hit density on y-axis vs. average distance from bullseye on x-axis. Continue line through x=0. b. State how the probability of a hit in any given unit area on the target varies with the distance of that area from the bullseye. Where would you put a square 1 cm on an edge on the target to maximize the likelihood of its being hit? c. Compare the hit density curve to the electron charge density curve in figure 15-2b. Where in the atom would you put a region of fixed volume if you wished to maximize the chance of finding the electron inside that volume? 3. a. Would you expect the radius of maximum probability for a dart hit to be the same for all students? (graph 1) Why? b. Would you expect the most probable radius of the 2s electron in a lithium atom to be the same as that for the 1s electron in a hydrogen atom? Why? Write a Summary