Download
1 / 60
620 likes | 909 Vues
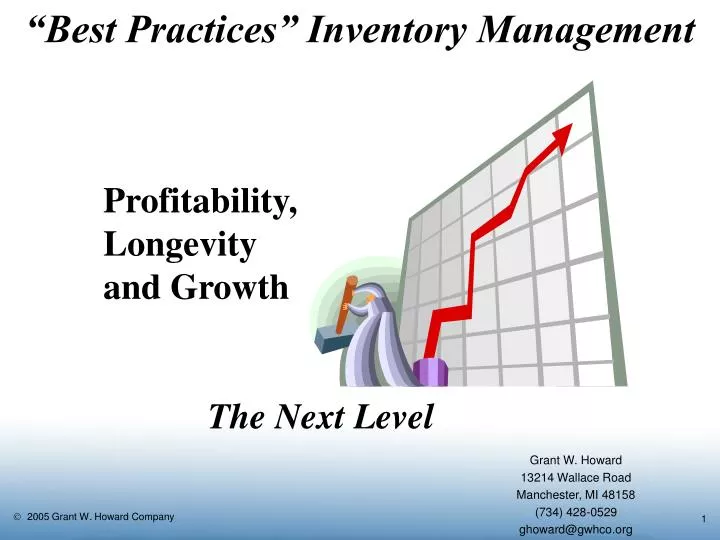
Profitability, Longevity and Growth. “Best Practices” Inventory Management. The Next Level. Grant W. Howard 13214 Wallace Road Manchester, MI 48158 (734) 428-0529 ghoward@gwhco.org. Our Discussion Today. The Big Picture The Replenishment Process Getting Results: Customer Service

E N D
Profitability, Longevity and Growth “Best Practices” Inventory Management The Next Level Grant W. Howard 13214 Wallace Road Manchester, MI 48158 (734) 428-0529 ghoward@gwhco.org
Our Discussion Today • The Big Picture • The Replenishment Process • Getting Results: • Customer Service • Profitability • Systems Utilization • Some Final Thoughts Through Slide 28 Today
Growth Profitability Longevity Warehouse Owner’s Returns and Happiness Procure Sell Communication, Structure, and Team Education and Understanding Systems and Tools Processes and Procedures Customer Service Vendor Performance Employee Happiness The Fundamental Tree Service, GM Improvement, Asset Manage- ment, Efficiency, Accuracy
Profitability ($&%): GM Improvement ($&%): Sales Increase - Loyalty: Sell Price x 2 Velocity Pricing Lost Business and Backorders More of Customer’s Business New Business COGS Decrease/Supplier Negotiations Expense Reduction: Asset Management: Freight Reduction Cost to Carry Reduction Rifle Approach Surplus, Safety Stock, RC/OC/OQ Replace Freight & Inventory with ... Efficiency and Accuracy: Cost to Replenish Reduction Replace Costs with ... Longevity: Customer Loyalty: Customer Service: Fill Rates Backorder Handling On-Time Delivery Accuracy - Product, Price, Quantity, Terms Ability to Solve Customer Issues Use Technology to ... Being Dynamic - its Critical: Adaptability to Market Changes Use Technology to ... Growth: Existing Customers: Lost Sales and Backorders Depth of Customer’s Business New Customers Profitability, Longevity and Growth
Procure: Inventory Management/Control Operations Sales Marketing Systems and Technology Warehouse: Operations Inventory Management/Control Systems and Technology Sales Marketing Sell: Sales Marketing Inventory Management/Control Operations Systems and Technology Profitability, Longevity and Growth Seems to be a Pattern? Where does Management fit into all of this?
Customers: Availability Backorder Handling On-Time Delivery Accuracy Product Quantity Price Terms Win-Win MEASURE Vendors: Not Just Price Win-Win MEASURE Employees: Want to do a Good Job Balanced Objectives/Team Tools, Processes, EDUCATE! Remove Stress, Give Method Win-Win MEASURE Profitability, Longevity and Growth
Communication, Structure and Team:Companies need to have a team concept, KNOWN balanced objectives, with a way to get there - Management! Systems and Tools:Companies need to understand and use more than 20, 30, 50% of their systems! Processes and Procedures:Companies need to have closed-loop, actual working processes and procedures! Education and Understanding:Companies need to education their people and help them be part of the solution! Profitability, Longevity and Growth
Inventory Management Getting Results When, What, How Much
The Replenishment Model A Good Replenishment Model addresses the two objectives of Customer Service and Profitability When to Replenish? What to Replenish and How much? What is incoming and will be late? What is incoming and will be early or is not needed? What is not needed?
“When to Replenish” Target/Incentive and/or Review Cycle - Profits Worthy Items Below Order Point with Target/Incentive and/or RC Considerations - Profits and Service “What to Replenishment” Line Buy (Make Target/Review Cycle) Fill In/Emergency Buy Transfers Do Nothing “How Much to Replenish” Up to Line Point/Remaining Cycle (Cycle Coverage - Freight/C to P) Compare to Suggested Order Quantity (EOQ/Class - CtoC and CtoP) Minimum Run Vendor/Transfer Package Rounding EOQ Order Cycle Surplus Point PNA/Level Line Point or Max/EOQ Lead Time Order Point or Min Safety “When, What and How Much”
Measurement Fill Rate, BO’s Turns, Excess, Mix T&E, GMROI Data to Info The Tools Data Usage - OE/WT Lead Time - PO/WT Level/PNA Info - OH & Paperfloat Purch Hist Replenishment Buyer’s Ctrl Center Items BOP/Priority The Numbers Hits/Ranking Order Cycle Ave Usage, Safety, OP, LP, Order Quantity Timeline Analysis Too Late Too Early Set-up “Smart” Set-up Co. and Whse. Product Pline Product Master Product Whse. Surplus Inventory External/Lng. Term Internal/St. Term Maintenance One Stop Inq/Maint Proofs/Mass Update Exc Control Center
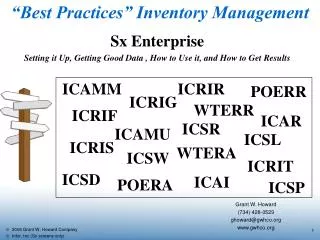
Measurement ICRIF - Fill Rate ICRIT - Turns ICRIR - T&E Data to Info The Tools Data Usage - OE/WT Lead Time -PO/WT Level/PNA Info - OH & Paperfloat Purch Hist Replenishment POERR/WTERR POERA/WTERA - BCC The Numbers ICAI - Rank ICAR - RC ICAMM - AMU, Safety, OP, LP, OQ Timeline Analysis ICRIG - Too Late ICRIG - Too Early Set-up ICSR - “Smart” ICSD - Whse ICSL - Pline ICSP - Prd Master ICSW - Prd Whse Surplus Inventory ICRIS - Ext/LT ICRIS - Int/ST Maintenance POERA - One Stop Proofs/Mass Update ICAMU - ECC
Know the Right Things to Do Do these Things Right Inventory Management is at the Time of Replenishment, the “When, What, and How Much”, Everything Else is Correction.
Service - Fill Rates? • How well a business meets its customer’s needs - pulse of customer’s happiness/loyalty. • What to Measure: Fill Rates = Shipped/Ordered Quantity: 9 out of 10 = 90% Line Item SC: 9 out of 10 = 0% Order Ship Complete? • What Should Fill Rates Be? • The Report is Broken? • Look at “First Pass” Orders - EDI, Fax, Internet, etc for true fill rates and backorder percentages • Only one way to better Fill Rates - The Right Inventory. Two ways to the Right Inventory...
Profitability Turns Profits - Turns? ROI? Freight, Cost to Carry and Cost to Purchase Maximize the Bottom Line C to PTurns 80’s $10.00 2-3 90’s $5.00 3-6 00’s $2-3.00 6-10 EDI/VMI $0.13? Many companies are increasing the turns, but the infrastructure does not support it; bottom line, longevity and growth are all suffering! Customer Service, GM Improvement, Efficiency, Accuracy, Asset Management
R O I TurnsWhat is it Measuring - Profits? CGM T&E GM% GMROI .25 .25 20% 20 .25 .50 20% 40 .25 1.00 20% 80 Turns DOES NOT measure Profits, Turns is an Indicator of Profits Turns is a Measurement of Utilization and Efficiency - i.e.., C to C Turns is a one-side Indicator of Profitability, it looks at C to C... - What about Margin, Freight, C to P and SERVICE? J M/A J/J S/O D C/I Turns 1.00 s1.25 1/1 1 c1.00 1.00 s1.25 s1.25 2/1 2 c1.00 c1.00 1.00 s1.25 s1.25 s1.25 s1.25 4/1 4 c1.00 c1.00 c1.00 c1.00 Inventory = Dollars! How many Times the Dollars are used to do Something
Inventory Management is not only Turns Customer Service Improvement - Availability, OTD, BO Handling Gross Margin Improvement - Sell Service (Price) and COGS Expense Reduction - Freight, Cost to Carry, Cost to Replenish Inventory Management is Bottom Line, Longevity and Growth 7 Turns & 4% Bottom Line or 5 Turns & 7% Bottom Line The “Whole” Picture Turns 4 5 6 7 Margin 35 30 25 20 Return 140 150 150 140
GMROI: = Turns CGM% = COGS GM Ave Inv COGS = Sls Turns GM% = Sales GM Ave Inv Sales = GM Ave Inv x x x x x x Return on Investment Turns: = COGS (+ $Transferred) Ave Inv T&E: = Turns GM% = COGS GM Ave Inv Sales No Directs, Non-Stocks or Pass-Throughs
Customer Service Availability (Fill Rates) Proper Backorder Handling On Time Delivery Accuracy: Item, Quantity, Price Profitability (ROI) GM Improvement (Sales and Cost) Freight Considerations - OC Analysis Efficiency & Asset Mgt: CtoC and CtoP Surplus Inventory & Safety Inventory Turns/Days supply, ROI/T&E/GMROI Service Profits Inventory Management Objectives Watch the C to C (Warehousing, Handling, Obsol. & Shrink, Taxes, Ins, Interest) Watch the C to P (Purchasing/Replenishment, Receiving & Put-away, A/P)
1. Right Inventory not Suffering because of Wrong 2. Controlled Replenishment 3. Stocking Policy 4. Good Numbers and Proper Use of Them (OP, Level, LP, and OQ) - Path to Service: Replenish at Order Point - Prio Usage: Lost Sales, DP Freight/C to C vs Service Line Buy vs Emergency Buy Understand LP and OQ Effect Customer ServiceAvailability, Backorders, OTD, Accuracy Back to Basics 5. Operations: • Backorder Policy and Handling • On-Time Delivery • Accuracy of Shipments and Billing 6. Fill Rates - Monitor, Drill Down, Find Areas of Improvement
7. Understand and Use: Customer Buying Habits Timeline Analysis NOOS Policy and Procedure Smart Selling/Transferring 8. Follow LP and EOQ Suggestions: Too many Fires BOP but not at Target Problems Customer ServiceAvailability, Backorders, OTD, Accuracy Keys to Good Fill Rates 9. “Never-Arrive” Incoming 10. Safety Stock Increase: • Safety Analysis (Over Utilizing) • Safety Increase: • Use a Rifle Approach • Watch the Profits Stellar Customer Service does not have to drive your inventory through the roof, it just has to be done smart.
Customer Service Availability (Fill Rates) Proper Backorder Handling On Time Delivery Accuracy: Item, Quantity, Price Profitability (ROI) GM Improvement (Sales and Cost) Freight Considerations - OC Analysis Efficiency & Asset Mgt: CtoC and CtoP Surplus Inventory & Safety Inventory Turns/Days supply, ROI/T&E/GMROI Service Profits Inventory Management Objectives Watch the C to C (Warehousing, Handling, Obsol. & Shrink, Taxes, Ins, Interest) Watch the C to P (Purchasing/Replenishment, Receiving & Put-away, A/P)
1. Stellar Customer Service 2. Controlled Replenishment 3. Stocking Policy 4. Good Numbers and Proper Use of Them (OP, LP, OQ, Level) - Path to Profitability: Up to LP, OQ, Min, Package Usage: Exceptional, DP Targets/Incentives Properly Line Buy vs Emergency Buy Availability (Sales, GM, Fires) ProfitabilityGM & Expenses (Freight, CtoC, CtoP) Back to Basics 5. Vendor Performance and Negotiations 6. T&E and/or GMROI - Monitor, Drill Down, Find Areas of Improvement
7. Excess and Defective Control: Prevention Disposition 8. Order Quantity Reduction: OC/RC (LP) Reduction: OC/RC Analysis/Paths, Watch Freight Lower Targets - Negotiate C to P Departments Tools/ Efficiency Suggested OQ Reduction (EOQ): Watch C to P Departments Proper C to C ProfitabilityGM & Expenses (Freight, CtoC, CtoP) Reduce Inventory/Increase Turns 9. Safety Stock Reduction: • Safety Analysis (Not Utilizing) • Safety Reduction: • Improve the Process • Use Rifle Approach • Watch the Service 10. Other Reductions: • “Never-Ship” Committed • Duplicate Products and Lines Turns the Right Way! Balanced Objectives - Increase turns/decrease inventory but DON’T EFFECT SERVICE!
EOQ Order Cycle Surplus Point PNA/Level Line Point or Max/EOQ Lead Time Order Point or Min Safety ProfitabilityGM & Expenses (Freight, CtoC, CtoP) Understand the Impact Areas: • Excess and Defective: • No one wants or needs • Control the Feelings • Let it Roll, Let it Go • Be Careful - C to C/Mix • Cost of Disposition • Line Point and Order Quantity: • “What” and “How Much” • Be Careful - C to P Departments • Order Point - Safety Stock: • “When” • Be Careful - Customer Service Least Risk Most Risk
Surplus Inventory Disposition BOP/GAP - Put of the fire: Short or Long Term BLP/Sugg Xfers - Use it where you can: Long Term Teach branches to use LT first. Don’t borrow stock and put branch in “need”. 1. Stock Balance: (“X” Months Supply) - With “To” branch approval/Before Buy 2. Sell Above Cost: Customer, Other Distributor 3. At Cost: Sell at cost, Return at cost with no charges (freight, restock) 4. Below Cost: Sell below cost, Return below cost and/or with charges 5. Sell Above “Write-off” Cost: Garage/Fire Sale, Flea Market, Auction House, Liquidation House 6. Dump at “Write-off” Cost: Donate, Scrap, Dump
“Best Practices” Inventory Management Improve Customer Service, GM, Asset Management, Efficiency, and Accuracy • Better SKU Coverage - System and Buyers • 50 - 70% SKU Coverage to 85-97% • 5-25,000 SKU/Buyer to 40,000-100,000+ • Improved Time Management • Improved Priority Setting • Improved Efficiency • Improved Accuracy • Technology and Core • Replace Inventory with Information • Rifle Approach • Better Numbers and Better Tools • Ability to Balance Profits and Service
Product Record Product Line Record Vendor Record Warehouse Record Company Record “Smart” Parameters Table Driven/Automated Depth Watch Hardcoding Balanced
EOQ Total Cost 24 x Avg. Monthly Usage x Cost to Purchase (“R”eorder cost) Unit Cost x Cost to Carry (“K”eep cost) Cost Per Unit Ordered Cost to Carry (“K”eep Cost) C to C C to P Cost to Purchase (“R”eoder Cost ) 1. Not less than “x” weeks supply (1 week) 2. Not more than “x” weeks supply (1 year) Quantity Ordered Economic Order Quantity (EOQ) The EOQ formula minimizes the “Cost of Reordering or Purchasing” and the “Cost of Keeping or Carrying” which develops the lowest total hidden inventory costs - the lowest total inventory costs. The “How Much” decision affects your bottom line and service!
Usage Rate 1 Item Cost $100.00 Cost to Carry 24% Cost to Purchase $4.00 EOQ 2 $100 Month Usage, 2 Month Supply Usage Rate 100 Item Cost $1.00 Cost to Carry 24% Cost to Purchase $4.00 EOQ 200 $100 Month Usage, 2 Month Supply EOQ $Mth Usage Mth’s Supply $Inv $CtoC $CtoP M’s Sup (2.00CtoP) .01 200 (16.67 years)2.00 4.00 4.00 141 (11.75 years) .10 63 (5.25 years) 6.30 4.00 4.00 45 (3.75 years) 1 20 (1.67 years) 20 4.00 4.00 14.1 (1.18 years) 10 6.3 (189 days) 63 4.00 4.00 4.5 (135 days) 100 2 (60 days) 200 4.00 4.00 1.41 (42 days) 1,000 .63 (19 days) 630 4.00 4.00 .45 (13.5 days) 10,000 .2 (6 days) 2000 4.00 4.00 .141 (4.2 days) 100,000 .063 (1.9 days) 6,300 4.00 4.00 .045 (1.35 days) 1,000,000 .02 (.6 day)20,000 4.00 4.00 .014 (.42 day) $CtoC = $Inv x Month’s Supply x 1/2 x 2% (1/2 for Average Inventory, 2% Monthly CtoC) What about freight percentage and RC days?
Buyer’s Control Center/Workbench On-line, Priorities, One-Stop, Drill Down, Maintenance, Targets
General rules of thumb: Days Dollars 1/2 way through OC/RC Cost to Carry vs Freight, Price, and Service: Key is equal days supply Increase or Decrease Use for Proper Emergency Buys/Fill-ins Making Targets Properly
Discounts and Price Increases Negative This is total days supply to have on the shelve, not to buy. Use the “up to vendor target logic*” (change order cycle days) to meet the days supply. *This method works well for periods less than 90 days supply (seasonal or large swing items - be careful). Be aware of future freight, minimum considerations, fill ins, NS and OAN items. If targets are involved, be sure to fill in the entire line not just the fast movers or work a deal. $C to C $Discount/Increase $C to C $Discount/Increase Positive Break Even Max. Potential Quantity Break Even (Days) = (2 x Discount% / Monthly C to C) x 30 Maximum Potential Savings (Days) = (Discount% / Monthly C to C) x 30
Ideal Too Late Too Early 7-30 days 0 + days 30 + days In Out Out In In Out Timeline Timeline Timeline Identification and Prevention are the Key Doesn’t matter if late if didn’t need Doesn’t matter if on time if needed earlier Time Line Analysis
CONTINUOUS Surplus Inventory Prevention Identification Disposition Goals/Plan Responsibility Coordination
“Smart” MonitoringSafety Stock - Service and Turns Properly managed safety stock will result, over time, in this configuration of remaining stock levels at time of receiving the replenishment PO. Impossible task if done manually. Enhancement automates the monitoring. X = Actual stock available at time of receiving X X Safety Stock Level 75% X X X 50% X X X X 25% Stock out X X
If there is no measurement, then it is all hearsay. Data-free conversations will cause lots of frustrations, cost lots of money and result in lots on disappointments... Use measurement and monitoring to confirm results and to drill down and find areas of improvement. Be sure to use a “aimed” (rifle) approach rather than a broad (shotgun) approach, or it will be lots of $$$ and probably disappointing!
Customer Service: Availability (ICRIF & SMRL) Safety Analysis (ICAMU) Accuracy: Actual and Billing Product (CM%) Quantity (CM%) Price (CM%) On-Time-Delivery Backorder Handling (ICRIN) Customer Defection (SMAC) Profits and ROI: Surplus - Prevention & Disposition (ICRIG & ICRIS) RC/OC/XC and OQ: Freight Dollars - As percentage of sales Turns - Really C to C and C to P (ICRIT) Turn and Earn - ROI (ICRIR) Safety Analysis (ICAMU) Measure Results Vendors? Employees? Efficiency? Accuracy? Do better on both sides!
Lower COGS Lower Freight Minimums Multiple Drops for Freight Combined P/O’s for Minimum Freight Paid Fill-ins Fill Rates Consistent Lead Times and OTD Accurate Shipping (Blanket Receiving) - Product, Quantity, Price Good Backorder Handling EDI/VMI/2-Way Information Flow - B2B Automated Product and Pricing Updates RGA’s on New Items Excess Inventory Returns Win/Win - Partnership Vendor Performance and Negotiations - It’s not just Price
Usage Data and Calculation: Lost Sales/Exceptional Sales Capability “Smart” Exception and “Auto” Correction “Path” Exception Reporting Flexibility to Where Usage Placed for Shipments, Backorders, and Credits Monthly, Weekly, Daily, Transaction Buckets DP/MRP Capability Flexibility with Method and Window by Rank Seasonal Capabilities: Individual “Parameter Driven” Seasonal Trending Lead Time Advance for Seasonal Items Season Shift Capability Dual Usage for Seasonal with Long Lead Times Threshold Minimums Rollup Capability Usage Forecasting Accuracy Analysis and Correction “Best Practices”Better Numbers - Order Point • Safety Stock Improvements: • Safety Days or Percentage • Safety Control by Rank • Method Control by Lead time • Safety Stock Analysis • Lead Time Improvements: • Minimum and Maximum • History File with Maintenance • History/Parameters by Path (Int/Ext) • Exceptions w/ Automated Ignore • Manual Exceptional Lead Times • Customer Buying Habits, Threshold Minimums and “Automated” Overrides • Use of Hits and “Smart” Item Ranking • “Smart” Parameters and Controls
Review/Order Cycle Improvements: Based on Purchasing History or Extended AMU Min, Max and Exception Transfer Cycle Days OC/RC Analysis Order Quantity (EOQ) Improvements: Co, Whse, Pline, Product level Vendor and Transfer (Path) Min and Max Supply Calculate but do not use (SP) Use of Hits and “Smart” Item Ranking “Smart” Parameters and Controls EOQ EOQ Total Cost Order Cycle Surplus Point PNA/Level Cost Per Unit Ordered Line Point or Max/EOQ “K”eep Cost Lead Time “R”eoder Cost Order Point or Min Safety Quantity Ordered “Best Practices”Better Numbers - Line Point and OQ
Buyer’s Control Center - BCC Priority Targets “Smart” Rounding Drill Down/Maintenance Proper combination of the three models and use of EOQ “One-stop” Thinking Time Line Analysis “Too Late” “Too Early” “Smart” Surplus - “True” Surplus Exception Control Center - ECC “Smart” exception reporting Mass Update “One-stop” thinking Safety Stock at Receipt Analysis Measurement and Monitoring “Best Practices” - Better Tools • Rounding Control and Smart WT • Three buying methods and WT’s: • LP with or without OQ • WT Cycle and Set weeks supply • Full control and Works together • Proper products, Proper quantities • Improved Stock Levels: • Orders, PO’s and WT’s Control • Future Sales Orders • Future P/O’s • Strong Suggested Count Program • WMS • Flexible Product Merge Utility • Stock Balancing Tools • Use of Hits and “Smart” Item Ranking • “Smart” Parameters and Controls
It’s not just good Software and Systems It’s not just good Processes and Procedures It’s not just good People and Education It’s not just good Management IT’S ALL OF THEM! It’s not just good Usage It’s not just good Order Points It’s not just replenishing at Order Point It’s not just the Timeline It’s not just working the Surplus IT’S THE ENTIRE PROCESS Same Company Different Software
Growth Longevity Customers Employees Vendors Profitability The Big Picture Service, GM Improvement, Asset Management, Efficiency, Accuracy Replace Inventory and Costs and Improve Service with Technology
Replace Inventory and Costs and Improve Service with Technology. Improve the Bottom Line with Technology Information, Efficiency, Accuracy (If it is not helping Service, if it is not helping Profits…)