Download
1 / 14
140 likes | 215 Vues
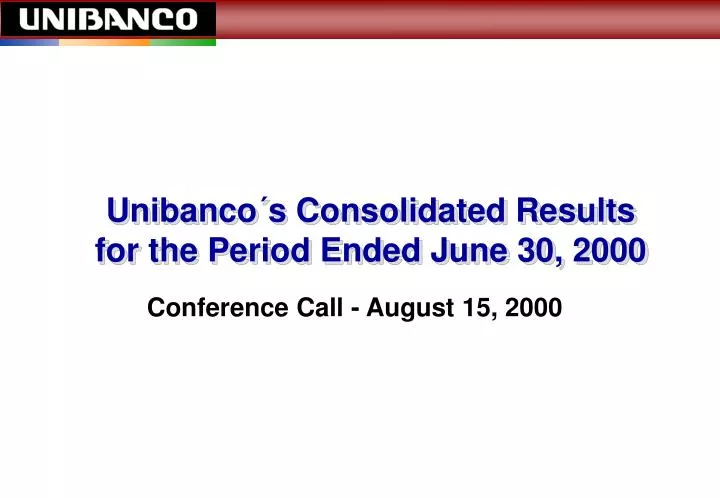
Unibanco´s Consolidated Results for the Period Ended June 30, 2000. Conference Call - August 15, 2000. %. Results and Capitalization. Net income (R$ million). 1S00. 1S99. Recurring 301 225 33.8 Non-recurring 50 82 (39.7) Total 351 307 14.3

E N D
Unibanco´s Consolidated Results for the Period Ended June 30, 2000 Conference Call - August 15, 2000
% Results and Capitalization Net income (R$ million) 1S00 1S99 Recurring 301 225 33.8 Non-recurring 50 82 (39.7) Total 351 307 14.3 Net worth (R$ million) 4,186 3,094 35.3 BIS Ratio - Bacen 16.2% 13.8%
Consolidated Income Statement In R$ million 2Q00 1Q00 2Q99 1S00 1S99 Gross Profit from Financial Intermediation 772 825 682 1,597 1,584 Provisions for Losses (net of recov.) (68) (194) (82) (262) (515) Fee Income 401 364 361 765 722 Personnel & Admin. Expenses (710) (665) (651) (1,375) (1,327) Other (148) 7 (104) (141) 29 Income Before Tax & Social Contribution 247 337 206 584 493 Tax & Social Contribution (51) (84) (36) (135) (77) Profit Sharing (48) (50) (66) (98) (109) Net Income 148 203 104 351 307
Quarter % change 8,098 7,311 7,216 10.8% 3,325 3,145 3,835 5.7% 11,423 10,456 11,051 9.3% 2,539 2,291 1,970 10.8% 489 474 369 3.2% 514 541 588 -5.1% 1,703 1,551 1,483 9.8% 5,245 4,857 4,410 8.0% 16,668 15,313 15,461 8.8% Loans In R$ million Year % change Jun/00 Mar/00 Jun/99 12.2% General Purpose Lending -13.3% Trade Finance 3.4% Subtotal 28.9% Personal Loans 32.5% Real Estate -12.7% Leasing 14.8% Credit Cards 18.9% Subtotal 7.8% Total
2Q00 1Q00 2Q99 1S00 1S99 Net Financial Margin In R$ million Profit from Financial Intermediation 705 631 600 1,336 1,069 Loan Recovery (110) (103) (170) (213) (243) Provision for Loan Losses 179 297 252 476 758 Provision for securities, G/L securities (1) (48) (6) (49) 134 Treasury non-recurring - - - - (210) Adjusted Margin 7737776761,5501,508 Annualized (%)(1) 11.1 11.7 9.8 10.2 11.6 (1) Over average of ending balances of loans and securities.
2Q00 1Q00 2Q99 1S00 1S99 Fee Income In R$ million Banking tariffs and other fees and commissions 198 181 174 379 345 Credit Cards 157 134 115 291 229 Assets under Management 46 49 72 95 148 TOTAL 401 364 361 765 722
2Q00 1Q00 2Q99 1S00 1S99 Personnel and Administrative Expenses In R$ million Personnel Expenses 270 261 264 531 518 Multiple Bank 189 184 190 373 371 Subsidiaries and affiliates 81 77 74 158 147 Administrative Expenses 440 404 387 844 809 Multiple Bank 285 268 247 553 534 Subsidiaries and affiliates 155 136 140 291 275 TOTAL 710 665 651 1,375 1,327 Efficiency Ratio (%)(*) 63.4 55.9 58.4 59.5 50.7 Fees/Pers. & Adm. Expenses (%) 56.5 54.8 55.5 55.6 54.4 (*) PIS/Cofins/ISS expenses (R$ 230 million in the 1S00) deducted from gross revenues for the purpose of calculating this ratio.
Provisions - Resolution 2682 Minimum Required R$ million Specific Credit Provisions % Classification Required Total Distribution Overdue Credits to Generic Total Cumulative Number of Days Provisions Loan (%) Credits mature Provision Provision Distribution Overdue (%) Portfolio AA 0 - 7,592 43.8 43.8 - - A 0 – 14 0.5 4,634 26.7 70.5 - 23 B 15 – 30 1 1,609 9.3 79.8 2 14 C 31 – 60 3 1,998 11.5 91.3 4 56 D 61 – 90 10 379 2.2 93.5 10 28 E 91 – 120 30 217 1.3 94.8 27 38 F 121 – 150 50 186 1.1 95.9 46 47 G 151 – 180 70 219 1.3 97.2 56 98 H > 180 100 493 2.8 100.0 256 237 TOTAL (*) 17,327 100.0 401 541 203 1,145 % of total provision 35.0 47.3 17.7 100.0 % over credit risk 2.3 3.1 1.2 6.6 (*) Total risk, including the loan portfolio and other receivables (guarantees honored, notes receivables and other generic receivables).
Operational Highlights 1S00 - Retail • Net increase of 117,000 clients with demand deposits • Active users of Internet Banking up 67,000 to reach 196,000, 43% of PC banking client base of 457,000 • 29% increase in demand deposits to R$ 848 million • 5% increase in loan outstandings to R$ 6.1 billion • 12% increase over 1S99 in cash management revenues from small companies to R$ 85.1 million (65% total cash management revenues)
Operational Highlights 1S00 - Wholesale • Ranked 1st in origination, 2nd in distribution of fixed income securities • Arranger of 12 syndicated lending transactions totaling R$ 2.0 billion • Ranked 1st in disbursements of BNDES onlendings (R$ 378 million) • 14% increase in Private Banking portfolio to R$ 5.0 billion • Completed 5 M&A advisories totaling over R$ 800 million
Operational Highlights 1S00 Unibanco Seguros • 24% increase over 1S99 in premiums written to reach • R$ 432.7 million • 6.1% decrease in expenses • Combined ratio down to 99.7 in 1S00 from 101.7 in 1S99 Unibanco Asset Management • 21% increase in assets under management to R$ 16.2 billion • Market share in mutual funds increase from 5.1% to 5.5%
- Credibanco acquisition concluded 04/19/2000 - Formation of Banco1.net in association with Portugal Telecom announced 05/19/2000 - Alliance with CGD for the acquisition of Banco Bandeirantes announced 07/03/2000 - B2B Alliance with Banco Galicia and Portugal Telecom announced 08/02/2000 1S00 Strategic Initiatives
99 98 97 96 Recent Trends Net Income - R$ million Loans - R$ million 16,668 15,811 591 14,046 454 12,158 11,758 431 351 307 285 246 177 127 Jun/00 Dec/99 Dec/98 Dec/97 Dec/96 1S00
Recent Trends Fee Income - R$ million Total expenses - R$ million 2,771 2,727 2,677 2,632 1,449 1,368 1,244 1,375 904 1,322 1,327 1,292 765 1,155 722 645 600 387 96 97 98 99 1S00 96 97 98 99 1S00