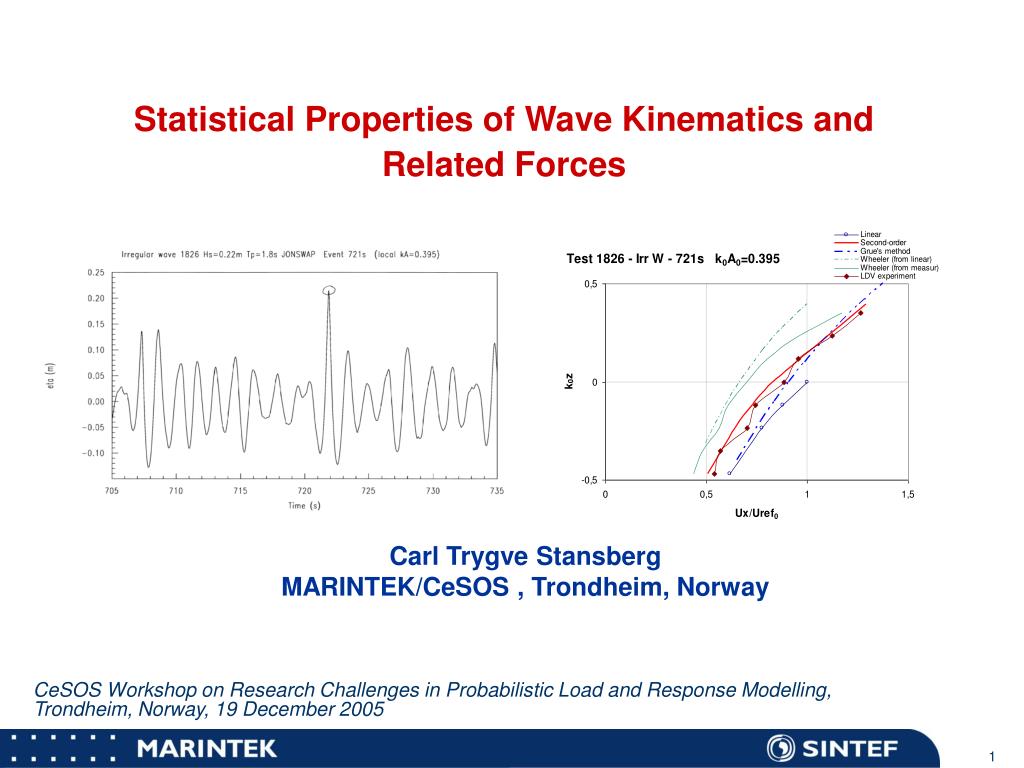
Statistical Properties of Wave Kinematics and Related Forces Carl Trygve Stansberg MARINTEK/CeSOS , Trondheim, Norway CeSOS Workshop on Research Challenges in Probabilistic Load and Response Modelling,Trondheim, Norway, 19 December 2005
Contents- Linear and second-order random wave kinematics modelling- Case study, storm wave- Simplified distribution model for free-surface velocity peaks- Effects on forces CeSOS Workshop on Research Challenges in Probabilistic Load and Response Modelling,Trondheim, Norway, 19 December 2005
Linear and second-order random wave kinematics modelling:- Here: Focus on horizontal particle velocities u(t,z) at a given vertical level z, for long-crested irregular waves on deep water(for simplicity)- Linear: u0(t,z) = i A(it) exp(jit) exp(kiz) z ≤ 0i- Second-Order: utot(t,z) = u0(t,z) + u(2 sum)(t,z) + u(2 diff)(t,z) z ≤ 0 utot(t,z) = u0(t,z) +(∂u0/∂z│z=0)∙z + u(2 sum)(t,0) + u(2 diff)(t,0) z > 0 (light blue: in finite water only)Here, u(2 sum) and u(2 diff) are given by their quadratic transfer functions (QTFs). We shall in particular consider the free-surface velocity u(z=(t)) at the crest peaks Ac. CeSOS Workshop on Research Challenges in Probabilistic Load and Response Modelling,Trondheim, Norway, 19 December 2005
Examples from numerical simulation, extreme events in random records:from Stansberg et al. (OMAE 2006) CeSOS Workshop on Research Challenges in Probabilistic Load and Response Modelling,Trondheim, Norway, 19 December 2005
Present case study- Hs=16m, Tp=14s, Gamma=2.5 (steep 100-year storm sea state)- Full-duration 3-hours storm record (1 realisation only, with 1000 wave cycles)- Simulate linear and second-order- Study probability distribution of crest heights Ac & velocity peaksUc CeSOS Workshop on Research Challenges in Probabilistic Load and Response Modelling,Trondheim, Norway, 19 December 2005
Sample time series, linear and second-order elevation CeSOS Workshop on Research Challenges in Probabilistic Load and Response Modelling,Trondheim, Norway, 19 December 2005
Sample time series, linear and second-order free-surface velocity CeSOS Workshop on Research Challenges in Probabilistic Load and Response Modelling,Trondheim, Norway, 19 December 2005
Sample time series, linear and second-order velocityat z=0 CeSOS Workshop on Research Challenges in Probabilistic Load and Response Modelling,Trondheim, Norway, 19 December 2005
Probability distributions from simulations, linear and second-order crest heights CeSOS Workshop on Research Challenges in Probabilistic Load and Response Modelling,Trondheim, Norway, 19 December 2005
Probability distributions from simulations, linear and second-order velocity peaks CeSOS Workshop on Research Challenges in Probabilistic Load and Response Modelling,Trondheim, Norway, 19 December 2005
Simplified second-order formula for maximum crest height:E[Amax] = AR (1 + ½ kp AR )(fromStansberg, (1998), based on Kriebel & Dawson (1993), Tayfun (1980))whereAR [ (2 ln (M)) + 0.577/ (2 ln (M))]kp = wave number = (2fp)2/gThis follows from modified Rayleigh distribution model for short-time statistics of nonlinear peaks a’:P[A < a’] = 1 -exp [-a2/22] where a = a’(1- ½ kpa) are the linear crestsThis formulation is based on second-order regular wave theory. CeSOS Workshop on Research Challenges in Probabilistic Load and Response Modelling,Trondheim, Norway, 19 December 2005
Simplified second-order formula for maximum crest height(cont.):The simple formula compares surprisingly well with full second-order simulations, see e.g. Stansberg (1998): although the negative difference-frequency effects are neglected.Likely reason: Use of the spectral peak frequency fpprobably leads to too long wave periods for the highest crests: Forristall (2000) suggests fAmax = 1.05fp for the highest crests. We think it should be even shorter, because in a random simulation it is locally shorter at a high peak than over the whole cyclus (found from Hilbert transform analysis of linear records). Thus we have found fAmax 1.15fp CeSOS Workshop on Research Challenges in Probabilistic Load and Response Modelling,Trondheim, Norway, 19 December 2005
Similarly, we use the same approach in suggesting a simplified second-order formula for high velocity peaks Uc at the free surfaceAssume regular waves:utot(t,z) = u0(t,z) +(∂u0/∂z│z=0)∙z which can be written, under the crest z=Ac: uC = u0(1 + kp Ac ) and the peak value distribution function becomes:P[u < uC] = 1 - exp [- u02/2u2] = 1 - exp [- uc2(1- kp Ac )2/2u2] (As for the crest heights before, we choose to use kp here, to compensate for the neglecting of difference-frequency terms).Notice: Nonlinear term is twice as important as for crests CeSOS Workshop on Research Challenges in Probabilistic Load and Response Modelling,Trondheim, Norway, 19 December 2005
Check of simplified crest height distribution(thin line), vs. simulations CeSOS Workshop on Research Challenges in Probabilistic Load and Response Modelling,Trondheim, Norway, 19 December 2005
Check of simplified velocity peak distribution(thin line), vs. simulations CeSOS Workshop on Research Challenges in Probabilistic Load and Response Modelling,Trondheim, Norway, 19 December 2005
Effect on velocity-determined wave forces (introductory study)Type 1: Wave slammingF ½ Cs A Uc2(slamming coefficient Cs 3 – 6, depending on relative angle)Type 2: Drag forcesF = ½ D CD u |u| (and then integrated up to the free surface)Here we limit our study to look at properties of the peaks of free-surface velocity squared – indicates the statistical properties of local forces CeSOS Workshop on Research Challenges in Probabilistic Load and Response Modelling,Trondheim, Norway, 19 December 2005
Sample record of u2, linear and second-order kinematics CeSOS Workshop on Research Challenges in Probabilistic Load and Response Modelling,Trondheim, Norway, 19 December 2005
Total 3-hour record of u2, with linear and second-order kinematics (u > 6.5m/s) Number of “events” increased by several 100%! CeSOS Workshop on Research Challenges in Probabilistic Load and Response Modelling,Trondheim, Norway, 19 December 2005
Probability distributions of u2, linear and second-order kinematics, including comparison to exponential model CeSOS Workshop on Research Challenges in Probabilistic Load and Response Modelling,Trondheim, Norway, 19 December 2005
Probability distribution of u2, with second-order kinematics,compared to simplified distribution based on:P[Y < y’] = 1 - exp[-y2/y2]where y = u02 (from linear velocity)y’ = y(1 + kpAc)2(from nonlinear velocity)(simplified distribution shown with dashed line) CeSOS Workshop on Research Challenges in Probabilistic Load and Response Modelling,Trondheim, Norway, 19 December 2005
Summary with conclusions- Statistical properties of particle velocity peaks in steep random waves have been investigated. - Second-order contributions lead to 30% increased maximum free-surface velocities (while crest heights are increased 15%)- A simple distribution model, similar to Kriebel & Dawson’s for crests, compares well with the simulated results- Preliminary studies of effects on resulting wave forces have been made by considering velocity squared.- The results show considerable contributions from second-order kinematics on forces – almost 100% increase. A simplified, modified exponential distribution model compares well with simulations- Further work recommended on statistical properties of integrated drag forces, and on related moments around z=0 CeSOS Workshop on Research Challenges in Probabilistic Load and Response Modelling,Trondheim, Norway, 19 December 2005