Download
1 / 1
10 likes | 88 Vues
This study explores how a self-paced tapping task can detect changes in prodromal Huntington's Disease, showing decreased precision as diagnosis nears. Results controlled for gender, age, education, and gene status, with significant predictors identified. Tables and graphs present demographic information, model outcomes, and key findings.

E N D
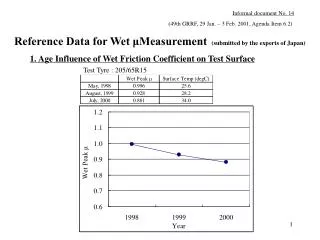
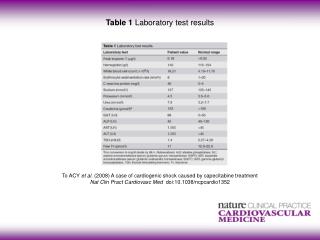
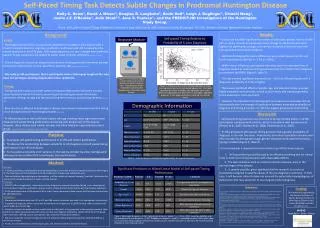
Self-Paced Timing Task Detects Subtle Changes in Prodromal Huntington Disease Kelly C. Rowe1, David J. Moser1, Douglas R. Langbehn1, Kevin Duff1, Leigh J. Beglinger1, Chiachi Wang1, Justin J.F. O’Rourke1, Julie Stout2,3, Jane S. Paulsen1,, and the PREDICT-HD Investigators of the Huntington Study Group. 1Roy J. and Lucille A. Carver College of Medicine, University of Iowa, Iowa City, IA, USA, 2Indiana University, Bloomington, IN, USA, 3Monash University, Melbourne, Victoria, Australia Self-paced Timing Relative to Probability of 5-year Diagnosis Response Module Figure 1: The response module is held in both hands and the thumbs rest on the response keys. The participant makes responses by pressing the response keys using alternating thumbs. Figure 2: Precision is the inverse standard deviation of mean inter-tap interval during the self-paced tapping task. The model controlled for effects of gender, age, education, gene status. Bimanual tapping precision decreases as participants approach diagnosis. In this graph, precision is centered at its overall mean. Demographic Information Table 1: T-test on age uses Satterthwaite approximation for unequal variances. Significant Predictors in Mixed Linear Model of Self-paced Timing Performance H•S•GHuntington • Study • Group Table 2: Total model R-square = 0.260. Comparison of case vs. control: t = -7.43, p <.0001, based on definition of pr-HD probability of 5-year diagnosis = 0.207. Probability of diagnosis (scale 0-1) calculated based on CAG repeat length and current age using Langbehn 2004 formula. Model outcome variable “precision” is defined as the inverse standard deviation of mean inter-tap interval.