Download
1 / 2
20 likes | 130 Vues
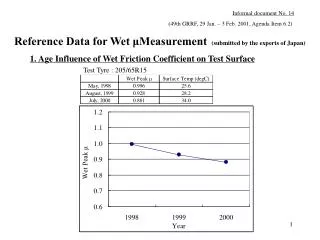
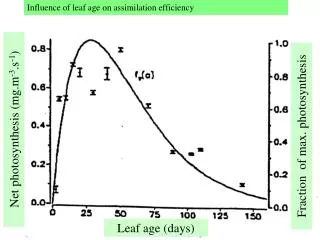
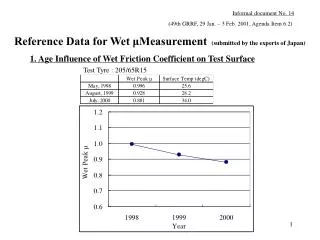
Informal document No. 14 (49th GRRF, 29 Jan. – 3 Feb. 2001, Agenda Item 6.2) Reference Data for Wet μMeasurement (submitted by the experts of Japan). 1. Age Influence of Wet Friction Coefficient on Test Surface. Test Tyre : 205/65R15. ABS Wet Braking Distance (V=80km/h).

E N D
Informal document No. 14 (49th GRRF, 29 Jan. – 3 Feb. 2001, Agenda Item 6.2) Reference Data for Wet μMeasurement(submitted by the experts of Japan) 1. Age Influence of Wet Friction Coefficient on Test Surface Test Tyre : 205/65R15
ABS Wet Braking Distance (V=80km/h) ABS Wet Braking Distance (V=80km/h) Test Tire Car A Car B Car C Car D Test Tire Car A Car B Car C Car D P195/75R14 ASTM 44.62 39.43 43.37 43.74 P195/75R14 ASTM 100.0 100.0 100.0 100.0 ( 0.56) (1.00) (0.37) (0.95) 195/70R14 X 110.6 111.8 = σ 195/70R14 X 40.35 35.25 205/60R15 Y 112.0 129.7 117.3 122.1 (0.64) (0.62) 205/60R15 Z 121.1 125.3 121.3 125.5 39.82 205/60R15 Y 30.40 36.98 35.82 (0.65) (0.35) (1.29) (0.31) Test Condition Load : Ave. 390kg/tire 205/60R15 Z 36.83 31.46 35.75 34.85 IP : 180kPa (ASTM), 190kPa (A,B,C) (0.46) (0.41) (0.32) (0.45) Water Depth : 1mm Air Temperature : 24 - 30 ℃ ABS Wet Braking Distance 50 45 40 Braking Distance (m) 35 ASTM X 30 Y Z 25 Car A Car B Car C Car D Tire Y Tire Z in the case of Car A & B ( Level of significance : 1% ) * ≠ 2. Test Data of Stopping Distance by Using Actual Vehicles ABS Wet Braking Distance 140 130 120 Braking Distance (relative %) ASTM X 110 Y Z 100 90 Car A Car B Car C Car D