High Friction Surface Site Selection Analysis
Explore Thurston County's data-driven, repeatable site selection analysis for high friction surfaces. Discover the study objectives, methodology, steps, and site facts to improve road safety.


High Friction Surface Site Selection Analysis
E N D
Presentation Transcript
High Friction Surface Site Selection Analysis EDC Exchange for Local and Tribal Agencies, June 26, 2014 Photo from High Friction Surface Roads (http://www.highfrictionroads.com/), High Friction Roads is maintained by pavement engineering firm The Transtec Group Scott Davis, PE Thurston County Washington State
Study Objectives Timely • Data Driven Repeatable,Repeatable, Repeatable,Repeatable,Repeatable,Repeatable
Study Methodology http://safety.fhwa.dot.gov/systemic/ Hybrid analysis approach
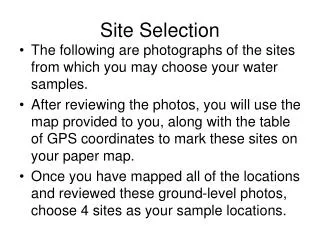
Step 1 – Network Data Collection Roadway Video Street View GIS Systems Mobility Database Crash Data
Step 2 - Surrogate Selection Skidding/Out-of-Control Driver Actions & Icy Roads 2006-2010 Fatal & Serious Collisions (xx) = Total Fatal & Serious Crashes % = percent skidding related crashes
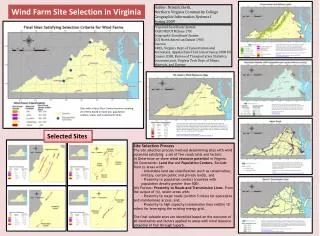
Step 3 – Facility Type Selection 90% of severe crashes occurred on arterial & collectorroads Arterial & collector roads represent about 33% of network length Wet, Icy and Skidding Crash Review Federal Functional Classification Map
Step 4 – Candidate Site Selection 67 Roads Reviewed 75 Candidate Sites Identified Site Facts 52are on horizontal curves 20are on vertical grades 6 are on curves identified in Horizontal Curve Systemic Analysis
Step 5 – Risk Factor Identification Speed Limit Roadway Classification Intersections Roadway Geometry Traffic Volume Traffic Control Type Shoulder Type Shoulder Width Severe Crashes 20 Intersection Focus List 20 Systemic Curve Focus List
Step 5 – Risk Factor Analysis Pivot Tables Charts Use Speed Limit Chart MS Excel Macros
Step 6 – Risk Factor Analysis Paved Shoulders of 4’ in width are over-represented Paved Shoulders of 8’ in width also have a small over-representation. Speed Limit (on-system roads) vs. Skidding/Out of Control Crashes Use Speed Limit Chart
Step 6 – Risk Factor Analysis Simple Scoring System Higher Confidence in results resulted in highest score Lower Confidence in results resulted in lowest score Served as Guide Only
Step 6 – Risk Factor Analysis 1 Point Factors Traffic Volume Horizontal Curve Posted Speed Limit
Step 6 – Risk Factor Analysis 1/2 Point Factors Shoulder Type and Width Horizontal Curve with on a grade Traffic Volume
Step 7 – Site Rankings Note: Crash totals and rates based on skidding/out of control crash types Vail Lp Rd SE Old Hwy 99 SE Reservation Rd SE
Wrap Up AID Accelerated Innovation Development Program 1st Planned High Friction Installation