Download
1 / 11
110 likes | 269 Vues
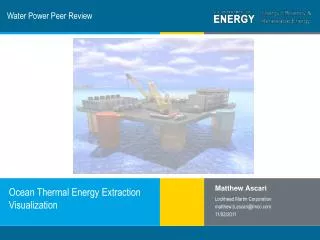
Water Power Peer Review. Matthew Ascari. Lockheed Martin Corporation matthew.b.ascari@lmco.com 11/02/2011. Ocean Thermal Energy Extraction Visualization. Purpose, Objectives, & Integration.

E N D
Water Power Peer Review Matthew Ascari Lockheed Martin Corporation matthew.b.ascari@lmco.com 11/02/2011 Ocean Thermal Energy Extraction Visualization
Purpose, Objectives, & Integration Interest in OTEC has a long history, and assessments of its potential have improved over the years. Still, they are based on ∆T1000 and resolution is poor. A thorough understanding of the available ocean thermal resource is necessary to establish effective OTEC and SWAC commercialization approaches and determine the potential impact (in terms of Giga Watts) on the energy market. The Ocean Thermal Extractable Energy Visualization (OTEEV) project focuses on assessing the Maximum Practicably Extractable Energy (MPEE) from the Ocean Thermal resource. MPEE is defined as being sustainable and technically feasible, given today’s state-of-the-art ocean energy technology and foreseeable future improvements. Results of the assessment are integrated into an interactive GIS tool available to the public for global resource visualization and location specific queries. Feb 05
Technical Approach [Describe the technical approach or methods used to achieve the project objective(s).] The Ocean Thermal Energy Evaluation and Visualization (OTEEV) project, rather than simply repeating previous assessments with up-to-date datasets, is using results from HYCOM, a global, high-resolution numerical ocean model run in assimilation mode. By inputting this data into our energy extraction model, we are able to produce a new dataset providing estimated net power per location across the world’s oceans. [Identify key issues currently being addressed and their significance.] A practical resource assessment is highly dependent on the cold water availability within the oceans and determining a sustainable rate of replenishment to establish maximum plant density. [Emphasize unique aspects of approach.] • Uses power extraction model to define average annual output per location • HYCOM datasets supply more information in a sharper geographical resolution, 1/12O • Multi year datasets include both strong El Niño and La Niña events • Depth selection of cold water source is optimized • Cold water replenishment rate equation is applied for global assessment
Plan, Schedule, & Budget Schedule • Initiation date: January 2010 • Planned completion date: December 2011 • [Milestones for FY10 and FY11] Dataset generation and Power Extraction Model • [Go/no-go decision points for FY12 and FY13] Successful GIS tool incorporation, extraction model and data validation. Budget: • [Describe any variances from planned budget and identify if/how the project plan was modified.] Project is on track and proceeding according to its original budget. • [Identify what portion of the project budget has been expended to date.] As of 9/25/2011, approximately 77% or $289K of the project’s allocated budget ($375K) has been expended.
OTEEV Power Equation • 100MW Nominal Net Power (PNET) Conditions Intake Head Loss Ammonia Pumping Static Head Loss (Due to Depth and Density Change) Pipe Friction Head Loss Warm Water Pumping Gross Power Condensers and Distribution Pumping • * Power (P) in MW, Temperature (T) in ºC, Depth (d) in meters, and Density (ρ) in kg/m³ • Variable Losses: • Pipe Friction Head Loss • Static Head Loss • Fixed Losses: • Intake Head Loss • Condensers and Distribution Pumping • Warm Water Pumping • Ammonia Pumping • D, dT and T0 defined by FAU provided data sets • Net Power calculated for each grid point • Output file generated for GIS integration
Accomplishments and Results [Describe the most important technical accomplishments achieved to date and their significance.] OTEC Power Extraction Model was completed based on nominal 100MW plant conditions and has been used to calculate location specific power output based on temperature and depth profiles from HYCOM datasets. [Relate the accomplishments to project milestones, barriers, and objectives.] The completion of the energy extraction model and subsequent validation efforts have enabled the project to move into its final phase of incorporating model output into the GIS tool.
Web Visualization and Query OTEEV Internet Accessible OTEEV Mock-up of visualization tool using January 2011 data Sea Surface Temperature (Megawatts) Multiple Layer Selections Temperature Delta Sea Water Air Conditioning Interactive Global Information This tool will allow visual exploration of the resource datasets, queries to bring up detailed attribute values, and the ability to download subset areas of interest.
Challenges to Date [Identify the most important challenges faced during this reporting period and their impacts on technical accomplishments and progress.] Establishing the replenishment rate for the cold water source in order to determine practical (sustainable) resource assessment of extractable energy. [Describe the approaches to resolving any issues or challenges faced during this reporting period.] The project team developed an algorithm to define OTEC Plant density based on current velocity and estimated cold water source replenishment.
Next Steps [Explain project plans for the rest of FY12 and/or to project completion; discuss remaining barriers that the project plans to address, and list upcoming milestones and deliverables.] • Load full model output into GIS tool and verify operation • Supply additional set of Sea Water Air Conditioning (SWAC) data to be included as a separate layer in the visualization tool • Validate tool operation • Deliver final technical report [Discuss possible next steps and their impacts; describe tasks that could be added or expanded; describe potential opportunities for future research and development suggested by project results.] The resource assessment completed under this project assumes a design that is most likely not optimized for specific locations and/or metocean conditions. Future research and development efforts could be focused on enhanced visual models of OTEC systems and assessing their impact on global circulation of the oceans.
Additional Slides Back-Up
Replenishment Rate of Cold Water Define a replenishment ratio R = ∆x∆z Vin / Fc as the rate at which the deep current brings in new, cold water relative to the withdrawal rate. Because the area from which the cold water is drawn is proportional to (Δx)2, a given R implies a draw-down area of (Δx)2 ~ (R Fc / Δz Vin)2 Inverting this allows definition of a plant density Đp = (Δx)-2 ~ ( Δz Vin / R Fc )2 For a 100 MWe OTEC plant, Fc ~ 300 m3/s. With a cold-water layer Δz=300 m and an inflow Vin of 1 cm/s, choosing R = 1000 yields Δx ~ 100 km, meaning Đp ~ 10-4 km-2 (one plant per 10,000 km2), or about one plant per 1° lat-long square.