Essential Guide to Clustering Techniques in R for Data Analysis
100 likes | 207 Vues
Discover the essentials of clustering in R, designed for statisticians and data miners. This guide introduces the powerful R programming language, ideal for statistical computing and graphics. Learn about key packages like "cluster" and "fpc", and explore vital functions such as "kmeans" and "hclust". Understand the main steps, including data preparation, applying K-means and hierarchical clustering, and visualization techniques. While R can handle large datasets effectively, it has limitations with nominal attributes and missing values. Elevate your data analysis skills with R!

Essential Guide to Clustering Techniques in R for Data Analysis
E N D
Presentation Transcript
Clustering in R Xue li CS548 showcase
Source • http://www.statmethods.net/advstats/cluster.html • http://www.r-project.org/ • http://cran.r-project.org/web/packages/cluster/index.html • http://cran.r-project.org/web/packages/
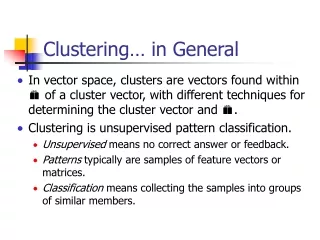
Introduction to R R is a free software programming language and software environment for statistical computing and graphics. (From Wikipedia) For two kinds of people: Statisticians and data miners Two main applications: Developing statistical tools, Data analysis
If you have learned any other programming language, it will be very easy to handle R. • If you don’t, R will be a good start
Package and function • http://cran.r-project.org/web/packages/available_packages_by_name.html
Clustering • Package: “cluster”, “fpc”… • Functions: “kmeans”, “dist”, “daisy”,“hclust”…
Main steps • Data preparation (missing value, nominal attribute…) • K-means • Hierarchical • Plotting/Visualization • Validating/Evaluation
disadvantage • Cannot handle nominal attributesand missing values directly • Cannot provide evaluating matrix directly
Advantage • Can handle large dataset • Write our own functions (Easier than Java in Weka)