Download
1 / 17
170 likes | 281 Vues
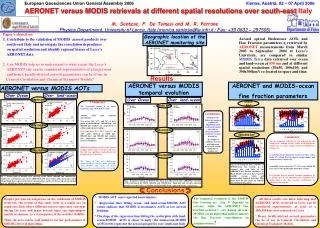
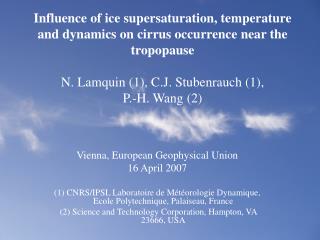
Influence of ice supersaturation, temperature and dynamics on cirrus occurrence near the tropopause N. Lamquin (1), C.J. Stubenrauch (1), P.-H. Wang (2). Vienna, European Geophysical Union 16 April 2007

E N D
Influence of ice supersaturation, temperature and dynamics on cirrus occurrence near the tropopauseN. Lamquin (1), C.J. Stubenrauch (1), P.-H. Wang (2) Vienna, European Geophysical Union 16 April 2007 (1) CNRS/IPSL Laboratoire de Météorologie Dynamique, Ecole Polytechnique, Palaiseau, France (2) Science and Technology Corporation, Hampton, VA 23666, USA
Is cirrus formation thermodynamically controlled ? • Cirrus clouds require high supersaturation to form, RHi > RHicritical • RHicritical depends on the type of nucleation, temperature, dynamics • Homogeneous nucleation: -freezing of aqueous solution droplets at T < -40°C • Heterogeneous nucleation: -requires lower supersaturation and involves aerosol particles -produces thinner cirrus
SAGE II, June 1987 – May 1991 (prior Pinatubo) SAGE II TOVS Sub-Visible Cirrus Thin Cirrus Cirrus Cirrostratus 0 0.03 0.3 3.0 Optical Depth SAGE cloud data provided by Pi-Huan Wang Wang et al., Atm. Res. 1994, JGR 1996, Atm. Res. 1998, JGR 2001 -Limb occultation at satellite sunrise / sunset at 7 wavelengths between 0.4 & 1 μm -pathlength: 200km x 2.5 km -vertical resolution: 1 km -vertical profile ends at ‘opaque’ cloud with extinction(1.02μm) > 2.10-2 km-1 Source: http://oea.larc.nasa.gov Source: Lynch, D.K., K. Sassen, D.O’C. Starr and G. Stephens. Cirrus. Oxford University Press, 2002
3I Inversion (Chédin, Scott 1985) TOVS Path-B climatology:1979, 1987- 1995, … Scott et al., BAMS 1999; Stubenrauch et al. J. Climate 2006 MSU+HIRS Rm(li,q)along H2O, CO2 absorption bands, good spectral resolution - atmospheric temperature (9 layers, 10hPa), water vapor(5 layers, 100hPa) - effective cloud amount (ECA), cloud top pressure (Stubenrauch et al. 1999) • - De, IWP of cirrus(CIRAMOSA, Rädel et al. 2003, Stubenrauch et al. 2004) • upper tropospheric relative humidity(Stubenrauch & Schumann 2005) • -determined for clear sky and cloud scenes with ECA < 0.6 • - RHi in two 200 hPa-thick layers: 100-300 hPa, 300-500 hPa
Tropopause and region of study 300-500 hPa TOVS layer for RHi Midlat South Midlat North Tropics Tropopause SAGE 100-300 hPa TOVS layer for RHi RHi taken in the layers situated under the tropopause for each region
RHi distributions Midlat North, 300-500 hPa Tropics, 100-300 hPa Clear: 6.5 % super- saturated events 60 % 60 % RHi clear < RHi SVC < RHi cirrus, 60 % works for all regions -INCA measurements (Ovarlez et al. 2002): peak of cirrus RHi distribution at 100 %, we find 60 % because of layer thickness → we define supersaturation by RHi > 60 %. -Microwave Limb Sounder measurements (Spichtinger et al. 2003): 5.98 % supersaturated clear events in the Tropics at 215 hPa while we find 6.5 % in a 200 hPa-thick layer centered around 200 hPa.
SVC occurrence as function of ISS occurence Positive correlation: -SVC formation is thermodynamically controlled -correlation is stronger in the tropics -extending results of Gierens, JGR 2000 (MOZAIC NH midlat)
SVC and Cirrus occurrence (4 years) < T >: 230 K - 250 K < T >: 215 K -Cirrus occurrence follows SVC occurrence in the tropics -Cirrus occurrence is constant in midlatitudes -Seasonal occurrences of SVC and Cirrus at (latitude,longitude) versus seasonal occurrence of ISS -« All seasons » = data taken at all seasons
Midlatitudes, two T domains (8 years) ECMWF ERA-40 wind fields, « Strong updraft » = strong ↑ and weak ↔ « Warm » = T > 240 K « Cold » = T < 240 K • different behaviours in NH and SH midlatitudes • strong large-scale updrafts increase strongly Ci occurrence in NH, not in SH • warm T (het. nucleation): Ci formation thermodynamically controlled • cold T: on average constant Ci occurrence
Tropics, influence of dynamics (8 years) Strong large-scale updraft increases already Ci occurrence at low ISS occurrence In situations with strong horizontalwinds (may diffuse moisture): less Ci « Weak » = all winds are weak « Strong » = one is strong, the other is weak
Midlatitudes North, two T domains, influence of dynamics (8 years) • cold T: horizontal wind as important as updraft • front dynamicsat meso-scale
Conclusions ● SVC: stronger thermodynamic control in the tropics ● Tropics: cold T, Ci formation thermodynamically controlled, stronger updrafts increase Ci formation already at low ISS occurrence ● Midlatitudes: warm T: Ci formation thermodynamically controlled, heterogeneous nucleation cold T: probably meso-scale processes dominate Outlook: ● AIRS: RHi on thinner layers ● Calipso: thin cirrus with more precise data ● link to models
Coherence of datasets (1) → ~28% of SAGE cirrus too thin to be detected by TOVS SAGE thin cirrus and cirrus SAGE SVC SAGE no high clouds
Coherence of datasets (2) « Cloudy » = Cloudy of high clouds Clear SAGE Clear TOVS Cloudy SAGE Clear Cloudy TOVS Cloudy Sum ( Clear/Clear + Cloudy/Cloudy ) = 63.5 % but…
Winds • Horizontal (√u2+v2), vertical (w) winds averaged on the 200 hPa-thick pressure levels • « Weak » and « strong » winds defined by regional and seasonal distributions using edges at 20 % Weak horizontal Weak vertical Strong horizontal Strong updraft Supersaturation occurrence is calculated seasonally, regionally and for each « wind case »
Determination of RHi • Precipitable water column: 300-100 / 500-300 hPa, W = → RHi(Δp) = gρ W / qs_ice(p)dp • 3I retrieved atmospheric T profile (30 levels) → ps calculated by Sonntag’s formulae (Sonntag, 1990): • qs determined by integration, steps of 1 hPa: