Download
1 / 7
70 likes | 322 Vues
Tipi di grafici. Caratteri Qualitativi Nominali o sconnessi Ordinati Quantitativi Discreti Continui. Grafici a torta. Grafici a barre. Grafici a bastoncini. Istogrammi. Esempio: variabile quantitativa discreta. X: numero di figli. 0. 1. 2. 3.

E N D
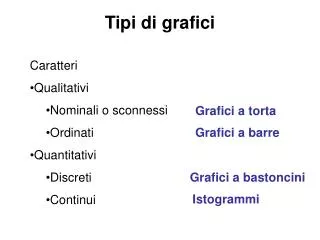
Tipi di grafici • Caratteri • Qualitativi • Nominali o sconnessi • Ordinati • Quantitativi • Discreti • Continui Grafici a torta Grafici a barre Grafici a bastoncini Istogrammi
Esempio: variabile quantitativa discreta X: numero di figli 0 1 2 3
Esempio: variabile quantitativa continua distribuzione unitaria distribuzione di frequenza
Funzione di ripartizionedi una variabile quantitativa Y Il simbolo va letto come porzione di unità statistiche che soddisfano la condizione espressa entro parentesi
Funzione di ripartizione empirica È calcolata a partire da una variabile osservata Esempio:
Funzione di ripartizione dedotta dall’istogramma (variabili continue) .