Evaluation Phase Overview: Making Informed Decisions
Understand the evaluation phase in decision-making process to identify risks, values, and best options. Learn about probabilistic analysis, decision trees, and NPV for financial assessment.

Evaluation Phase Overview: Making Informed Decisions
E N D
Presentation Transcript
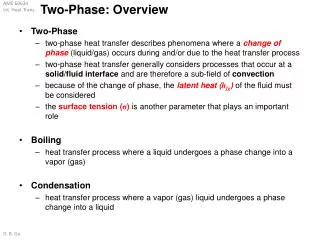
Decision Board Frame Alter-natives Plan Project Team Spreadsheet Model Decision Tree A B C 1 2 3 4 5 Assessed Probabilities Tornado Diagram Probability Distributions The third step in the IMSCG decision process evaluates the alternatives to identify sources of value and risk. EvaluatedAlternatives The goals of the phase are understanding, insight, and communication. 2.01 • Evaluation Phase Overview
$ • Base case evaluation of alternatives 1 2 3 4 Why? • Sources of value • Sources of risk • Probabilistic analysis The deliverables of the evaluation phase illustrate the implications of choosing one alternative over another. The level of analysis varies with the complexity and importance of the decision. Evaluation stops if the best choice is clear, based on sources of value or sensitivity analysis. 2.01 • Evaluation Phase Overview
Dialogue Decision Process Assess Situation Develop Alternatives Evaluate Alternatives Plan for Implementation Project Team Specific steps provide a logical approach for conducting the evaluation phase. Structure Deterministic Analysis Probabilistic Analysis Insight Generation Decision InitialSituation These steps will allow us to organize our discussion in the evaluation phase. 2.01 • Evaluation Phase Overview
A A ModelC = A + B ModelC = A + B 39 C C 86 B B 47 A deterministic model has single-valued inputs and outputs; probabilistic analysis addresses uncertainty. Deterministic Analysis Probabilistic Analysis • One variable value for each input • “Assumes away” uncertainty • Probability distribution for each uncertain input variable • Explicitly analyzes uncertainty 2.01 • Evaluation Phase Overview
Structure Deterministic Analysis Probabilistic Analysis Insight Generation Decision InitialSituation Iteration DeterministicModel DecisionTree Strategy Table A B C 1 2 3 4 5 InfluenceDiagram TornadoDiagram ProbabilityDistributions Decision Quality Several tools provide insight throughout the evaluation phase. 2.01 • Evaluation Phase Overview
A B C 1 2 3 4 5 We break down our discussion of the evaluation phase into the following topics. • The art of spreadsheet modeling • Base case and sensitivity analysis • Introduction to probabilistic analysis • Probability assessment and biases • Structuring decision trees 2.01 • Evaluation Phase Overview
Appendix 2.01 • Evaluation Phase Overview
We will introduce the main concepts to be used during the evaluation phase. • Evaluation Phase Overview • Net Present Value Review 2.01 • Evaluation Phase Overview
If I were to give you a $100k gift, would you prefer to receive it today or in a year from now? • What about $100k today or $120k a year from now? • If the lottery announces a $25 million prize, why does the winner get ~$14 million when he goes to collect it? …it’s all about the time-value of money! 2.01 • Evaluation Phase Overview
NPV is a simple, accurate, easy-to-interpret measure for financial analysis. • NPV is a measure of wealth creation that incorporates time-value of money • It represents the net amount generated by an investment expressed in today’s dollars. • NPV is easy to calculate and interpret. • If an investment has a positive NPV, it creates wealth. • If an investment has a negative NPV, it consumes wealth - and should be rejected. • NPV allows for easy comparison between investments. • The maximum NPV is preferred. • The NPV of a sum of independent projects is the sum of their NPVs. • NPV is clear and straightforward compared with old methods of investment appraisal, such as IRR and profitability index. • NPV is widely used and understood by the business community. 2.01 • Evaluation Phase Overview
To illustrate the use of NPV when making investment decisions, consider the situation facing Acme Corporation*. • Acme wishes to expand capacity by modifying an existent plant or by building a new plant. Modify Plant Initial Investment: $ 4M Build New Plant Initial Investment: $ 7M We will use NPV to help Acme make the right choice. * This example is based on R. A. Brealey, S. C. Myers, Principles of Corporate Finance. 2.01 • Evaluation Phase Overview
Modify Plant Year 0 –4 –4.0 1 4 –3 1 2 4 –3 1 3 4 –3 1 4 4 –3 1 5 4 –3 1 6 4 –3 1 7 4 –3 1 8 4 –3 1 9 4 –3 1 10 4 –3 0.6 1.6 Capital Investment ($M) Sales Cost of Goods Sold Salvage Value Net Cash Flow ($M) Build Plant Year 0 –7 -7.0 1 4 –2.4 1.6 2 4 –2.4 1.6 3 4 –2.4 1.6 4 4 –2.4 1.6 5 4 –2.4 1.6 6 4 –2.4 1.6 7 4 –2.4 1.6 8 4 –2.4 1.6 9 4 –2.4 1.6 10 4 –2.4 0.8 1.6 Capital Investment ($M) Sales Cost of Goods Sold Salvage Value Net Cash Flow ($M) Step 1: We shall compute cash flows in each year—“cash in minus cash out.” The initial investment is done at “time 0” or today All other cash flows are assumed to happen at the end of each period Based on Acme’s assumptions, the new plant will not impact sales, though it will reduce production costs and have a higher salvage value 2.01 • Evaluation Phase Overview
Cash flow after taxes is the proper basis for calculation. • Depreciation itself is not a cash flow. Depreciation only affects cash flows through tax effects. • Only tax savings due to the tax deductibility of depreciation are a cash flow. • Interest and dividends are not cash flows. • They are taken into account by discounting. • Only Overhead generated by the project should be included. Beware of allocated overhead. • Include working capital cash flows – they must be financed. 2.01 • Evaluation Phase Overview
Only incremental cash flows matter. • Forget sunk costs. • Do not include past expenditures. No project should be kept going just because a lot of money has already been spent on it (valid also for relationships). • Include opportunity cost. • E.g.: Using land has an opportunity cost. It is not free. • Include terminal value – any residual value past the timeframe of the model • More applicable to company valuations than product valuations. • Usually estimated through a multiple or a perpetuity • Include the financial impact of all side effects (impact on other parts of the business). • E.g.: Learning from new technology, environmental savings, etc. 2.01 • Evaluation Phase Overview
Be consistent in the treatment of inflation. • Use nominal discount rates with nominal cash flows. • The actual number of dollars and the actual interest rates. • The preferred way in the US, Europe and Japan • Use real discount rates with real cash flows. • Taking into account inflation – so the numbers represent what would have happened in the absence of inflation. • The preferred way in high inflation countries • Different cash flows have different inflation rates (tax shields do not inflate; labor tends to be higher than CPI). 2.01 • Evaluation Phase Overview
Step 2: We shall calculate the “discounted value” or “present value” of each cash flow. Year Modify Plant 0 –4 –4.00 1 4 –3 1 0.91 2 4 –3 1 0.83 3 4 –3 1 0.75 4 4 –3 1 0.68 5 4 –3 1 0.62 6 4 –3 1 0.56 7 4 –3 1 0.51 8 4 –3 1 0.47 9 4 –3 1 0.42 10 4 –3 0.6 1.6 0.62 Capital Investment ($M) Sales Cost of Goods Sold Salvage Value Net Cash Flow ($M) Discounted Cash Flow The discounted or present value is the amount of money in today’s dollars that is equivalent to the cash flow in a particular year. This is calculated as: Cash flow in Year i (1 + discount rate)i Year Build Plant 0 –7 –7.00 1 4 –2.4 1.6 1.46 2 4 –2.4 1.6 1.32 3 4 –2.4 1.6 1.20 4 4 –2.4 1.6 1.09 5 4 –2.4 1.6 0.99 6 4 –2.4 1.6 0.90 7 4 –2.4 1.6 0.82 8 4 –2.4 1.6 0.75 9 4 –2.4 1.6 0.68 10 4 –2.4 0.8 1.6 0.93 Capital Investment ($M) Sales Cost of Goods Sold Salvage Value Net Cash Flow ($M) Discounted Cash Flow 2.01 • Evaluation Phase Overview
The tricky part is to select the appropriate Discount Rate. • Any use of capital imposes an opportunity cost to a firm – funds are diverted from earning a return on another investment. • Uses of capital must be benchmarked against capital market investment options - only those that can earn in excess of its cost of capital create value for investors. • The Discount Rate to use is the organization’s weighted average cost of capital (WACC) • The WACC is the weighted average of the cost of individual sources of capital employed in the company: WACC= KEquity* WEquity + (1-tax rate)*Kdebt * Wdebt K = Component cost of capital W = weight of component as a % of total capital • In most cases, as consultants, we will use the corporate Discount Rate – computed and provided by our client’s Finance department. 2.01 • Evaluation Phase Overview
Modify Plant Year 0 –4 –4.00 $2.4M 1 4 –3 1 0.91 2 4 –3 1 0.83 3 4 –3 1 0.75 4 4 –3 1 0.68 5 4 –3 1 0.62 6 4 –3 1 0.56 7 4 –3 1 0.51 8 4 –3 1 0.47 9 4 –3 1 0.42 10 4 –3 0.6 1.6 0.62 Capital Investment ($M) Sales Cost of Goods Sold Salvage Value Net Cash Flow ($M) Discounted Cash Flow NPV (at 10%) Σ Σ Build Plant Year 0 –7 –7.00 $3.1M 1 4 –2.4 1.6 1.46 2 4 –2.4 1.6 1.32 3 4 –2.4 1.6 1.20 4 4 –2.4 1.6 1.09 5 4 –2.4 1.6 0.99 6 4 –2.4 1.6 0.90 7 4 –2.4 1.6 0.82 8 4 –2.4 1.6 0.75 9 4 –2.4 1.6 0.68 10 4 –2.4 0.8 1.6 0.93 Capital Investment ($M) Sales Cost of Goods Sold Salvage Value Net Cash Flow ($M) Discounted Cash Flow NPV (at 10%) Step 3: The NPV is the sum today’s cash flow plus all future discounted cash flows. 2.01 • Evaluation Phase Overview
Plotting NPV versus discount rate avoids the difficulty of choosing a single discount rate. • For Acme Corporation, we find that Build Plant is better than Modify Plant for any discount rate less than 15 percent. 10 Key 9 Modify Plant Build Plant 8 7 6 5 NPV ($ millions) 4 3 2 1 0 –1 –2 0 5 10 15 20 25 Discount Rate (%) 2.01 • Evaluation Phase Overview
$700K NPV High-Yield Improvement $600K .5 ($2,000K) $585K Expected NPV = $400K .5 Low-Yield Improvement $200K ($2,000K) NPV is the value measure of choice for investment valuation. • A cash flow can have only one NPV. • NPV distinguishes good (NPV+) from bad (NPV-) projects. • A higher NPV represents higher value creation. • NPV is able to handle changing discount rates. • This is useful for changing inflation and different long-term versusshort-term rates. • NPV can be extended to include uncertainty. 2.01 • Evaluation Phase Overview