Regional Transportation Plan Draft: Hybrid Scenario & Funding Proposal Overview
The Draft of the Regional Transportation Plan incorporates significant updates from the July 16th Transportation Policy Committee, notably including the I-10 Reliever as a full freeway and significant transit program revisions. A proposed sales tax balance of $129 million aims to fund vital highway improvements and transit services. It reviews transportation model outputs, including traffic volumes, transit ridership, and service levels. Key next steps involve planning for air quality conformity and enhanced funding for critical transportation infrastructure through revised gas and diesel tax rates.

Regional Transportation Plan Draft: Hybrid Scenario & Funding Proposal Overview
E N D
Presentation Transcript
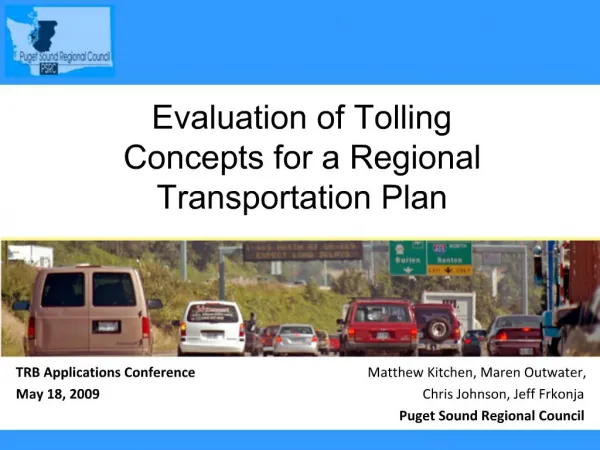
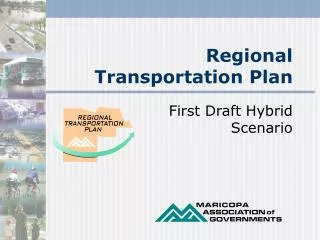
Regional Transportation Plan Draft Hybrid Scenario Transportation Policy Committee 7/22/03
Final Draft Stage of Regional Transportation Plan • Started with the July 16th TPC 3rd Draft Hybrid: • No bus local match • I-10 Reliever as interim with no connection to SR 85 • Sales tax balance of $129 million
Proposed Hybrid Changes since July 16th. • TPC request to include I-10 Reliever as full freeway with interim facility between L303 and SR 85. • Transit program revisions • City of Phoenix proposal to fund I-17 improvements
Regional Shares Population Shares Funding Shares
Per capita VMT by facility type and mode. Percent of trips on transit (mode split). Total transit ridership. Pollution emission index. Point-to-point travel times. Peak period speed by facility type. Number of intersections by level of service. Freeway and street miles by level of service. Peak period delay by facility type. Percent of transit dependent persons served Households within one-quarter mile of transit service. Percent of persons within 30 and 60 minutes of employment. Households within five miles of park-and-ride lots and transit centers. Jobs within one-quarter mile of transit service. Transportation Model Output – System Level
Transportation Model Output – Link/Route Level • Freeway and street traffic volumes. • Transit route ridership. • Freeway and street peak period speeds. • Intersection level of service. • Freeway and street level of service.
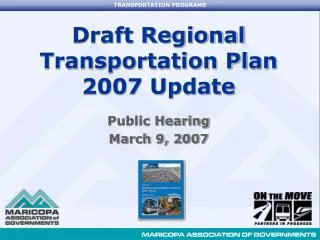
Next Steps • Approval of the Draft Final Stage of the RTP on July 22nd • Modeling of hybrid. • Develop implementation program • Plan refinements based on modeling and comments. • September adoption for air quality conformity.
Index Gas & Diesel Index Gas Taxwith Inflation
Index Gas Taxwith Inflation • Added revenues for ADOT • MAG’s share: 750 million • Rest of state: 950 million • Total: $1.7 billion • MAG Cities & County $940 million • Total for MAG Region$ 1.7 billion • Gas Tax Rates: • Current: 18 cents • 2025: 33 cents
Index Gas and Diesel Taxwith Inflation • Added revenues for ADOT • MAG’s share: 1.1 billion • Rest of state: 1.3 billion • Total: $2.4 billion • MAG Cities & County $ 1.3 billion • Total for MAG Region $2.4 billion • Diesel Tax Rates: • Current: 26 cents • 2025: 47 cents