Download
1 / 56
570 likes | 662 Vues
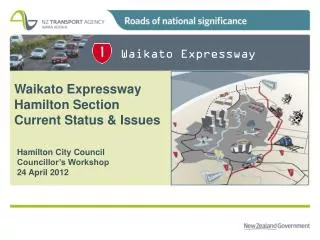
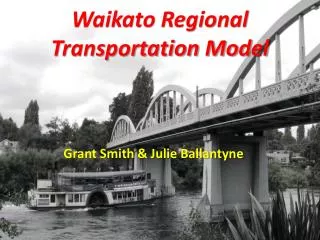
Waikato Regional Transportation Model. Grant Smith & Julie Ballantyne. Items to cover. Objectives of WRTM. Items to cover. Objectives of WRTM Project Timetable. Items to cover. Objectives of WRTM Project Timetable Data Collected. Items to cover. Objectives of WRTM Project Timetable

E N D
Waikato Regional Transportation Model Grant Smith & Julie Ballantyne
Items to cover • Objectives of WRTM
Items to cover • Objectives of WRTM • Project Timetable
Items to cover • Objectives of WRTM • Project Timetable • Data Collected
Items to cover • Objectives of WRTM • Project Timetable • Data Collected • Model Capabilities
Items to cover • Objectives of WRTM • Project Timetable • Data Collected • Model Capabilities • Model Form
Items to cover • Objectives of WRTM • Project Timetable • Data Collected • Model Capabilities • Model Form • Model Basic Statistics
Items to cover • Objectives of WRTM • Project Timetable • Data Collected • Model Capabilities • Model Form • Model Basic Statistics • A Look at the Future
Items to cover • Objectives of WRTM • Project Timetable • Data Collected • Model Capabilities • Model Form • Model Basic Statistics • A Look at the Future • Interesting Issues
Objectives for the WRTM • A single transport model for the Waikato Region As opposed to • Two modelling platforms • Five different models
Objectives for the WRTM • A single transport model for the Waikato Region As opposed to • Two modelling platforms • Five different models • Quality data and modeling: Currently • Previous Models used old or borrowed data • Asking more of existing models
Objectives for the WRTM • A single transport model for the Waikato Region As opposed to • Two modelling platforms • Five different models • Quality data and modeling: Currently • Previous Models used old or borrowed data • Asking more of existing models • Minimise project and administration overhead: • Range of project managers and administrators
Project Timetable Project = Model Build + Operation
Project Timetable Project = Model Build + Operation Contract signed 19th October 2007
Project Timetable Project = Model Build + Operation Contract signed 19th October 2007 Initial Completion date April 2009
Project Timetable Project = Model Build + Operation Contract signed 19th October 2007 Initial Completion date April 2009 Delayed by Home Interview Survey
Project Timetable Project = Model Build + Operation Contract signed 19th October 2007 Initial Completion date April 2009 Delayed by Home Interview Survey Clean HIS data available March 2009
Project Timetable Project = Model Build + Operation Contract signed 19th October 2007 Initial Completion date April 2009 Delayed by Home Interview Survey Clean HIS data available March 2009 Model build completed Jan 2010
Data Collected • Household Interview Surveys
Data Collected • Household Interview Surveys • Survey March 2008 to January 2009 • Face-to-face interviews conducted • 2,000 Households (1,000 in Hamilton) • Saturday Survey for additional 500 HHs • Trip rates: • Unexpanded = 9.4 daily person trips/HH • Expanded = 11.2 daily person trips/HH
Data Collected • Household Interview Surveys • Roadside Interview Surveys
Data Collected • Roadside Interview Surveys • Survey December 2007 to March 2008 • 18 locations in total • Auckland & Tauranga data borrowed • All vehs, 1 direction, 12 hours • 6 Hamilton Sites ANPR
Data Collected • Household Interview Surveys • Roadside Interview Surveys • Bus Passenger Interview Surveys
Data Collected • Bus Passenger Interview Surveys • Survey July 2008 to November 2008 • Survey 50% peak & 33% off-peak services • On-board interview survey • Interviewed 4,700 passengers • 30% sample (16k pax/day) • Expand to EW patronage data
Data Collected • Household Interview Surveys • Roadside Interview Surveys • Bus Passenger Interview Surveys • Census Data (JTW & Crosstabs)
Data Collected • Household Interview Surveys • Roadside Interview Surveys • Bus Passenger Interview Surveys • Census Data (JTW & Crosstabs) • Traffic Counts
Data Collected • Household Interview Surveys • Roadside Interview Surveys • Bus Passenger Interview Surveys • Census Data (JTW & Crosstabs) • Traffic Counts • Journey Time Surveys
Capabilities of the Models • Two models • Vehicle driver • Person
Capabilities of the Models • Vehicle Driver • Includes light and heavy vehicles separately • Three periods • Morning Peak – 0700 to 0900 • Inter peak – 1100 to 1300 • Evening peak – 1600 to 1800
Capabilities of the Models • Vehicle Driver Suitable for • Road network analysis • Network operation • Landuse planning • Inputs to economic analysis
Capabilities of the Models Person model Outputs are trips by mode • Car Driver • Car Passenger • Bus Passenger • Walk and Cycle
Capabilities of the Models Person model • Two Periods • Morning Peak – 0700 to 0900 • Inter Peak – 1100 to 1300
Capabilities of the Models Person model Suitable for • Travel demand management analysis • Bus Passenger service design • Land use Planning
Model Form Standard three and four step models
Model Form Standard three and four step models Trip generation – 10x4 category model
Model Form Standard three and four step models Trip generation – 10x4 category model Gravity Distribution - -ve exponential functions
Model Form Standard three and four step models Trip generation – 10x4 category model Gravity Distribution - -ve exponential functions Logit mode split model
Model Form Standard three and four step models Trip generation – 10x4 category model Gravity Distribution - -ve exponential functions Logit mode split model Assignment – full Intersection modelling
Some Basic Statistics 900 Zones
Some Basic Statistics 900 Zones 8400 Nodes
Some Basic Statistics 900 Zones 8400 Nodes 20,000 Links
Some Basic Statistics 900 Zones 8400 Nodes 20,000 Links 13 Trip Purposes
Some Basic Statistics 900 Zones 8400 Nodes 20,000 Links 13 Trip Purposes Three step takes 6 minutes per period
Some Basic Statistics 900 Zones 8400 Nodes 20,000 Links 13 Trip Purposes Three step takes 6 minutes per period Four step takes a little longer
Some Basic Statistics 900 Zones 8400 Nodes 20,000 Links 13 Trip Purposes Three step takes 6 minutes per period Four step takes a little longer TRACKS software
A look at the future Deficiency analysis at 2006 2021 2041
550 500 450 400 350 300 Kilometres of Road Affected by LOS Number of Intersections by LOS 250 200 150 100 50 -50 0 2006 2021 2041 2006 2021 2041 0.9 43.6 72.1 22 50 83 LOS F LOS F 30.2 56.5 109.6 23 19 35 LOS E LOS E 42.8 93.7 129.8 38 44 54 LOS D LOS D 107.5 171.8 210.7 210 223 287 LOS C LOS C Example Model Outputs
Hamilton PM peak LOS 2006
Hamilton PM peak LOS 2021