Download
1 / 26
270 likes | 319 Vues
This study delves into the impacts of land use change in Asian Pacific regions on the carbon cycle, focusing on carbon sources and sinks, emissions, effects on forests, and future projections. Insights from APN projects, carbon budgets, forest ecosystems, and case studies in Indonesia and Mongolia are discussed, shedding light on carbon fluxes due to land use changes over the years. The research emphasizes the importance of understanding the drivers and mechanisms behind these changes and highlights potential solutions for managing terrestrial carbon in the future.

E N D
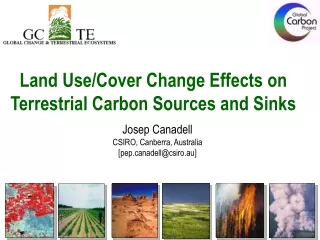
Land Use/Cover Change Effects on Terrestrial Carbon Sources and Sinks Josep Canadell CSIRO, Canberra, Australia [pep.canadell@csiro.au]
Outline • APN project and GCTE/GCP • Carbon Emissions • Indonesia • China • Fire emissions • Erosion and Riverine transport • Future emissions • Carbon Sinks • Sink Mechanisms • Forest sinks in Japan
APN Project: “Land Use Change and the Carbon Cycle in Asia [APN2000-02]” Workshop: Kobe, January 2001 • Commissioned Studies: • Land Use Change and Carbon Cycle in Arid and Semi-Arid Lands of East and Central Asia. Chuluun. • Carbon Budgets of Forest Ecosystems in Southeast Asia Following Disturbance and Restoration. Lasco. Support the development of two Research Proposals for GEF-IPCC: An Integrated Assessment of Climate Change Impacts, Adaptation and Vulnerability in Watershed areas and communities in Southeast Asia. Lasco. Potential Impacts of Climate Change and V&A Assessment for Grassland Ecosystem and Livestock Sector in Mongolia. Chuluun. APN-GCTE Special Journal Edition: Land Use/Cover Change Effects on the Terrestrial Carbon Cycle in the Asian Pacific Region “Science in China, Life Sciences – Series C Editors: Josep Canadell, Guangsheng Zhou, Ian Noble
[180-200 PgC from land use change] + 90 ppm CO2 in the atmosphere [40 ppm due to changes in land use] 124 Pg emitted due to land use change 60% in tropical areas %40 in temperate areas Global Emissions from Land Use Change Historically Total emissions of C [deforestation and fossil-fuel burning] 450 PgC 1 Pg C = 1,000,000,000,000,000 g C (a billion tones) From 1850 to 1990 90% due to deforestation [20% descrease Forest Area] Houghton et al. 1999, Houghton 1999, Defries et al. 1999, IPCC-TAR 2001
6,3 Fossil Fuel Tropical Asia Latin America Africa North America China Net Annual Flux of Carbon from Changes in Land Use 1.4 1.2 1.0 0.8 0.6 0.4 0.2 0.0 Annual Net Flux of Carbon (Pg) 1840 1860 1880 1900 1920 1940 1960 1980 2000 Year Houghton 1999 Houghton 2002 – APN-GCTE Special Issue, 2002
Annual C Emissions Tropical Asia and China [1850-2000] Houghton 2002 – APN-GCTE Special Issue
Annual Flux of Carbon in Tropical Asia and China [1850-2000] Houghton 2002 APN-GCTE Special Issue
C Density of various land covers in Indonesia Land cover C density % of Natural Forest* Carbon Pools Measured Source of data Oil-palm (10yrs) Oil-palm (10 yrs) Oil-palm (14 yrs) Oil-palm (19 yrs) Coffee Natural forest 62 31 101 96 18 325 19 10 31 30 6 - Aboveground biomass [30] Mature agroforest (rubber jungle) 5-yr old rubber Oil palm plantation Coffee mixed garden Undisturbed rainforest 104 15.6 62.4 18 390 27 4 16 5 - Aboveground and below ground [18] Rubber agroforests Rubber agroforests with selected planting material Rubber monoculture Oil palm monoculture Natural forest 116 103 97 91 254 46 41 38 36 - Aboveground biomass and upper 30cm of soil [17] Rubber jungle 35.5 14* Aboveground biomass [32] Home gardens 35-40 20* Tree biomass [30] Oil palm (30 yrs) 40.3 16* Aboveground biomass and necromass [34] Cinnamon 39 15* Aboveground biomass [31] Cinnamon 44 17* Aboveground biomass [31] Lasco 2002 – APN-GCTE Special Issue and Commissioned Study 2001
CO over Western Pacific at 10 Km [1993-2001] Jambi Province, Sumatra Frequency of Hot Spots Murdiyarso 2002 – APN-GCTE Special Issue Matsueda 2002 – APN-GCTE Special Issue Forest Fires and Carbon Emissions
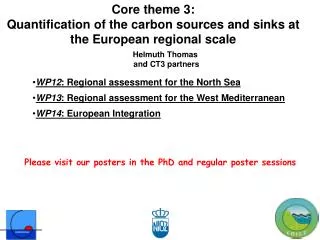
C Fluxes and Concentrations In the Godavari Basin, India Global River Transport of C 60% Sarin 2002 APN-GCTE Issue 0.24 Pg yr-1 River Transport of Carbon in the Godavari Basin, India
Land Covers and aCO2 in 2050 using IPCC-SRES Agricultural Land Forest Area 7000 6000 5000 B1 4000 A2 A1b Total forest area (Mha) A1b_fastmigration 3000 A1b_nonegfb 2000 1000 0 1970 1995 2020 2045 2070 2095 Year CO2 Emissions [714 ppm – 1009 ppm] 35 30 25 20 Total CO2 emissions (Pg C/yr) 15 10 5 0 Scenarios: ‘material consumption’ (A); ‘sustainability and equity’ (B) 'globalisation’ (1) ‘regionalisation’ (2) 1970 1995 2020 2045 2070 2095 Year Leemans 2002 – APN-GCTE Special Issue
% Difference in Net Primary Production [1870-1990] [Existing - undisturbed land cover] NPP loss NPP gain DeFries et al. 1989
Terrestrial Carbon Sources and Sinks [1990’s] - 1.7 - 0.8 + 0.7 + 0.3 + 0.6 Pg C/yr IPCC 2001 Schimel 2001
Terrestrial Carbon Sources and Sinks [1990’s] Pg C/yr - 1.7 - 0.8 - 0.7 - 0.3 - 0.6 IPCC 2001 Schimel 2001
Current Terrestrial Sinks Potential Driving Mechanisms Land Use/Cover Change • CO2 fertilization • Nitrogen fertilization • Climate change • Regrowth of previously harvested forests • Reforestation / Afforestation • Regrowth of previously disturbed forests • Fire, wind, insects • Fire suppression • Decreased deforestation • Improved agriculture • Sediment burial • Future: Terrestrial Carbon Management (e.g., Kyoto) Canadell 2002 – APN-GCTE Special Issue
30 25 20 15 10 5 0 Asian Russia Canada Live Vegetation (Pg C) Coterminous US Euro Russia Europe China 1950 1960 1970 1980 1990 2000 Carbon Stocks in Live Forest Vegetation [1950-1995] • Forest Expansion • Cropland abandonment • Declining logging • Reforestation Goodale et al 2002
0.38 Pg C comes from planted forests Changes in Forest Carbon in China [1949-1998] Between 1940’s and 70’s, C storage declined by 0.68 Pg C due to forest exploitation policies From late 1970’s to present, C storage has increased by 0.4 Pg C due to policies of protection and timber production [+ 0.021 Pg C/yr] Fang et al. 2001
2000 1992 1996 Land Use Change and C loss in NE China [1992-2000] Decrease forest area: 2.76104km2 Increase urban area: 2.32104km2 Potential max. loss of 273.2 Tg C Wang 2002 – APN-GCTE Special Issue
Net C Gain from Managed Forests in Japan [2000-2015] 70-yr Rotation Sink: 16 MtC/yr 4% FF emissions Alexandrove & Yamagata 2002 – APN-GCTE Special Issue
Land use change and carbon cycle in arid and semi-arid lands of east and central Asia - Chuluun • Changes in annual fluxes of CO2 in South Korea from 1990 to 1997: contributions of energy consumption, land-use change, and forest regrowth – Dowon • Carbon Emissions and Sinks from and into Agro-Ecosystems– Lind Erda • Carbon balance along Northeast China Transect (NECT-IGBP Transect). Guangsheng Zhou • Carbon stock assessment for a forest-to-coffee conversion landscape in Sumber-Jaya (Lampung, Indonesia): from allometric equations to land use change analysis. Meine van Noordwijk.
Landsat TM image, Paragom.,1991, classified as forest and non-forest [Brazilian Government reporting methodology] – 62% Forest Same image, classified after ranch owners interviews: only 1/10 of the above forest was classified as undisturbed forest by human practices – 6.2% Forest Hidden Deforestation: Carbon Implications • Forest Impoverishment: • Surface fires • (could be responsible for doubling • C emissions during El Nino years) • Logging • (4-7% of that of forest conversion) Nepstad et al. 1999
Soil Carbon Responses to various Land Use Changes Global - Meta-analyses of 71 studies Guo and Gifford 2002
Contemporary and Future Terrestrial Carbon Sources and Sinks Global Change Effect s on Vegetation and Disturbance Regimes Global Change, Agroecological Processes and Production Systems Changing Biodiversity and its Consequences on Ecosystem Functioning GCTE Global Change and Terrestrial Ecosystems [gcte.org]