CMS HF PMT SYSTEM
CMS HF PMT SYSTEM. By Y. ONEL U. of Iowa, Iowa City, IA HF-RBX PRR CERN Apr 3-4, 2003. CMS-HF PMT Test and Quality Control System. U. Akgun 1 , A.S. Ayan 1 , F. Duru 1 , E. Gulmez 2 , M. Miller 1 , J. Olson 1 Y. Onel 1 , I. Schmidt 1


CMS HF PMT SYSTEM
E N D
Presentation Transcript
CMS HF PMT SYSTEM By Y. ONEL U. of Iowa, Iowa City, IA HF-RBX PRR CERN Apr 3-4, 2003
CMS-HF PMT Test and Quality Control System U. Akgun1, A.S. Ayan1, F. Duru1, E. Gulmez2, M. Miller1, J. Olson1 Y. Onel1, I. Schmidt1 with Quarknet Group – P. Bruecken, C. Like, R. Newland 1 University of Iowa, Iowa City, USA 2 Bogazici University, Istanbul, Turkey Abstract We have measured the specifications proposed by the CMS-HCAL committee on the candidate phototubes from the three major manufacturers; Hamamatsu, EMI and Photonis. In this report, we present the results from those measurements and we outline the future measurements for the test and the quality control as well as the design of the new University of Iowa PMT test station facility.
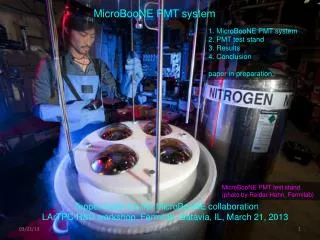
Tasks of the Test System For one tube in every batch: Double-pulse linearity, Gain vs HV for each batch Single photoelectron spectrum X-Y scan (spatial uniformity) Lifetime For each tube: Pulse width Pulse rise time Transit time Transit time spread Anode dark current Relative gain coupled with cathode sensitivity, Pulse linearity Quality control decision on each tube.
Double Pulse Linearity Results on 10 PMTs Note: Statistical error is %0.9
Definition of Relative Gain and Gain Relative Gain (Normalized Output): Anode output of a PMT when exposed to the same light intensity (±2%) as the Reference PMT and normalized with respect to the output of the Reference PMT For each PMT, Reference PMT is also tested. Gain: Anode output current / Cathode output current
Relative Gain vs Gain CONCLUSION: We can sort pmts w.r.t. their Relative Gain values
Relative QE This calculation is done on only 120 PMTs @ 1100V Note:Gain vs HV tests were done for these 120 PMTs beforehand, so the gains of each PMT is known. Output is Relative Gain values (100 for Ref) (Output = Gain * QE)
Timing characteristics after 1100 C • After more than 1100 C of charge accumulation: • - No change in timing properties. • Gain dropped to %70 of initial value. • Experiment is still on.
PMT Web Database Sort by column (Ascending or Descending) Alternating colors to aid readability Pagination reference for large data sets More extensive search/sort options are being developed
CMS IN 2002/026 CMS IN 2002/032 CMS Notes
CMS IN 2002/029 CMS IN 2002/030 CMS Notes