Optimizing the iTRAQ Multiplexing Strategy for Quantitative Proteomics Analysis of
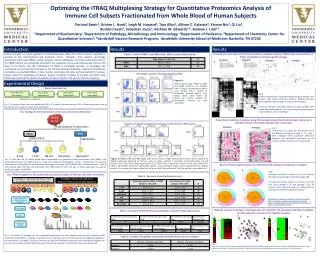
Optimizing the iTRAQ Multiplexing Strategy for Quantitative Proteomics Analysis of Immune Cell Subsets Fractionated from Whole Blood of Human Subjects. NK Cell. T D0. ICCS 1. ICCS 2. T D1. T D7. T D3. Monocyte. Neutrophil. ICCS 1. ICCS 2. PBMC. T Cell. B Cell. Whole Blood.

Optimizing the iTRAQ Multiplexing Strategy for Quantitative Proteomics Analysis of
E N D
Presentation Transcript
Optimizing the iTRAQ Multiplexing Strategy for Quantitative Proteomics Analysis of Immune Cell Subsets Fractionated from Whole Blood of Human Subjects NK Cell T D0 ICCS 1 ICCS 2 T D1 T D7 T D3 Monocyte Neutrophil ICCS 1 ICCS 2 PBMC T Cell B Cell Whole Blood Ficoll Gradient Fractionation Parimal Samir1, Kristen L. Hoek2, Leigh M. Howard3, Tara Allos2, Allison C. Galassie4, Xinnan Niu2, Qi Liu5, Buddy Creech6, Sebastian Joyce2, Kathryn M. Edwards3,6, Andrew J. Link1,2 1Department of Biochemistry; 2Department of Pathology, Microbiology and Immunology; 3Department of Pediatrics; 4Department of Chemistry; Center for Quantitative Sciences5; 6Vanderbilt Vaccine Research Program; Vanderbilt University School of Medicine; Nashville, TN 37232 PBMC PMN MACS/FACS MACS/FACS Intensity B Cell T Cell NK Cell Monocyte Neutrophil m/Z Introduction Results Results Systems biology is a novel approach to comprehensively study the human immune response to vaccines at the transcriptional and proteomic levels. However, most systems vaccinology approaches utilize total PBMCs in their analyses. This is problematic since the predominant cells in the PBMC fraction can potentially overwhelm the responses of the underrepresented immune cell types in the blood, and the contribution of PMNs is completely ignored. To investigate the contribution of the individual cell types in the immune response following a seasonal TIV influenza vaccination, we purified PBMCs, T-cells, B-cells, monocytes, NK cells, and neutrophils from venous human blood for quantitative proteomic studies. Proteomic analysis of immune cell types using iTRAQ was performed to identify candidate proteins involved in the vaccine immune response. Table A. Yield of PBMCs and PMNs from ~88mL human venous blood Hierarchical clustering and principal component analyses using the iTRAQ data show strategy 2 is better at identifying cell-type specific changes Strategy 1 Strategy 2 Strategy 1 Strategy 2 D C A B Experimental Design Phenotypic analysis of human blood by FACS Figure 4: Whole blood (top), PBMC (middle) and PMN (bottom) cell samples from a single representative donor were stained with a cocktail of antibodies directed against CD3, CD11c, CD14, CD15, CD19, and CD56 cell surface markers for phenotypic analysis by flow cytometry. Blood draw time line Day 0 (prior to vaccination) Day 1 (post- vaccination) Day 3 (post- vaccination) Day 7 (post- vaccination) Fig. 6: (A and B) Hierarchical clustering analysis to group samples and proteins with similar expression patterns. Related cell-types group together using strategy 2, but not with strategy 1. (C and D) Principal component analysis to group samples with similar expression patterns. The same cell types group together using strategy 2, but not strategy 1. Seasonal TIV Flu Vaccine A B Fig. 1: A human subject was vaccinated with 2011-12 trivalent Influenza vaccine. 100 mL blood was drawn prior to vaccination and on days 1, 3 and 7 post-vaccination. Our strategy for the fractionation of immune cells from whole blood Hierarchical clustering of proteins using fractionated human blood and strategy 2 allows us to identify immune cell-specific changes after vaccination Immune cell types isolated from venous human blood at >98% purity More cell-type specific proteins are identified with strategy 2 compared to strategy 1 Strategy 1 Strategy 2 Fig. 7: A heat map of z scores for each protein across the different cell-types at days 0, 1, 3, and 7. Both strategies reveal significant differences between the cell-specific proteomes as the immune system responds to the vaccination. Fig.8: Cell-type enrichment analysis of all the proteins identified using strategy 1 (A) and strategy 2 (B). Cell type enrichment analysis of proteins from NK cells using strategy 1 (C) and strategy 2 (D). All analysis was performed using the web-based tool “cell type enrichment for genome studies” a. C D Fig. 2: Cells from 90 mL whole blood were fractionated into peripheral blood mononuclear cell (PBMC) and polymorphonuclearcell (PMN) fractions using Ficoll gradient centrifugation. Using a combination of magnetic activated cell sorting (MACS) and fluorescence activated cell sorting (FACS), PBMCs were fractionated into T cells, B cells, natural killer cells (NK) and monocytes with >98% purity for each cell type. A similar approach was used to purify neutrophils from PMNs. Figure 5: PBMC (left) and PMN (right) cell fractions from a single representative donor were subjected to MACS enrichment followed by FACS in order to obtain purified T cell (CD3+ CD15-CD19-CD14-), B cell (CD19+ CD15-CD3-CD14-), monocyte (CD14+ CD15-CD3-CD19-), myeloid DC (CD11c+ CD15-CD3-CD19-CD14-CD56-), NK (CD56+ CD15-CD3-CD19-CD14-CD11c-), and neutrophil (CD15+ CD3-) populations for systems analysis. For sorting, cells were stained as in Figure 4 with the addition of 7AAD to exclude non-viable cells. Two iTRAQ strategies for the quantitative proteomic analysis of immune cells after vaccination Table B. Recovery of purified immune cells Strategy 1: Multiple Cell Types from Same Time Point Pooled Together Strategy 2: Same Cell Type from Different Time Points Pooled Together Protein extraction followed by trypsin digestion aShoemaker, J.E., Fukuyama, S., Sakabe, S., Kitano, H., Kawaoka, Y. (2011). Transcription-based Functional Modeling of the Host Response: Defining a Healthy Immune Response to Influenza Virus Infection. ICSB, Heidelberg, Germany. iTRAQ label Network analysis of changes in the proteome of T cells after TIV vaccination identifies candidate protein networks involved in the adaptive response Table C. Summary of LTQ-Orbitrap XL parameters used for iTRAQ experiments Pool B D C A D0 D1 D3 D7 D0 D1 D3 D7 Analysis by LC-MS/MS Fig. 3: We tested 2 strategies for the multiplexed quantitation of the changing immune cells’ proteome after vaccination using iTRAQ. In strategy 1, multiple immune cell types from one time point were multiplexed together in the experiment. In strategy 2, the same immune cell type from different time points were multiplexed together. An immune cell common standard (ICCS) was used to normalize reporter ion intensities across the experiments. Table D. Summary of peptides and protein identified from the two strategies Fig. 9: The heat maps (A and C) were generated based upon the fold change compared to the common control. B) Networks of proteins whose expression increases 1 day after vaccination. C) Networks of proteins whose expression increases at day 7, post-vaccination.