Download
1 / 16
160 likes | 325 Vues
Find the expected values for the following contingency table: A study examined whether the risk of hepatitis C was related to whether people had tattoos and to where they got their tattoos. Warm-Up 2/23/11. Making Sense of Statistics!!!!. Which tests work and why….

E N D
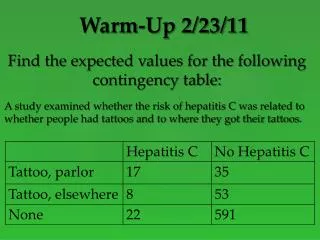
Find the expected values for the following contingency table: A study examined whether the risk of hepatitis C was related to whether people had tattoos and to where they got their tattoos. Warm-Up 2/23/11
Making Sense of Statistics!!!! Which tests work and why…
What were the expected values??? Let’s Look at the Warm-Up
When doing a chi-squared test of independence you CANNOThave an expected value < 5 We have a problem!!!
DISAPPEAR How could we change the contigency table to make this problem
How? • Combine categories… • Which ones??? • Combine “Tattoo, parlor” and “Tattoo, elsewhere” to create a category “TATTOOS” Need to increase observed values…
Both linear regression and chi-squared test of independence are trying to show if there is a relationship between two variables…so what do we need to look at to decide? • The TYPE of data: • CATEGORICAL – use chi-squared test • QUANTITATIVE – use linear regression But what if I am not told what test to use???
Need to be able to make a contingency table • Need categories for each variable in order to create a contingency table • When collecting data to use a χ2 - test on, you need to be able to tally • Ex: Dominant Hand vs. Walked Left/Right • Cannot have expected value < 5 Χ2 – Test: Categorical Data
Need to have variables to put on x-axis and the y-axis • For linear regression to be useful in determining the relationship between two variables the scatterplot must be “straight enough” • No outliers Linear Regression: Quantitative Data
Even if you hit the fast food joints for lunch, you should have a good breakfast. Nutritionists, concerned about “empty calories” in breakfast cereals, recorded facts about 77 cereals, including their Calories per serving and Sugar content (in grams). How are calories and sugar content related in breakfast cereals? Which Statistical Test???
Company policy calls for parking spaces to be assigned to everyone at random, but you suspect that may not be so. There are three lots of equal size: lot A, next to the building; lot B, a bit farther away; and lot C, on the other side of the highway. You gather data about employees at middle management level and above to see how many were assigned parking in each lot. Which Statistical Test???
There is some concern that if a woman has an epidural to reduce pain during childbirth the drug can get into the baby’s bloodstream, making the baby sleepier and less willing to nurse. In 2006 a study was conducted at Sydney University. Researchers followed up on 1178 births, noting whether the mother had an epidural and whether the baby was still nursing after 6 months. Which Statistical Test???
Colleges use SAT scores in admissions process because they believe these scores provide some insight into how a high school student will perform at a college level. Data was collected on SAT scores and freshman year GPA to test this belief. Which Statistical Test???
Group Work Get in to pairs and come up with data you could collect and research questions you could answer using: • Linear Regression • Chi-Squared Test of Independence