Understanding Volume, Statistics, and Data Representation in Mathematics
710 likes | 842 Vues
This resource covers key mathematical concepts such as volume calculations using a cylindrical container, basic statistical principles, and data representation techniques. The container's water volume is explored through an example, alongside the significance of using samples to infer population characteristics. It includes a vocabulary section defining terms such as population, sample, and survey, in addition to explanations on stem-and-leaf and dot plots. The guide highlights the importance of understanding mean, median, and measures of central tendency and illustrates how box plots are utilized in data interpretation.

Understanding Volume, Statistics, and Data Representation in Mathematics
E N D
Presentation Transcript
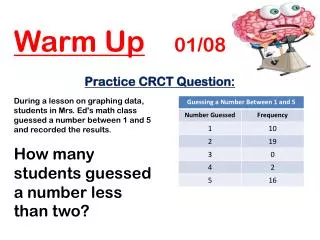
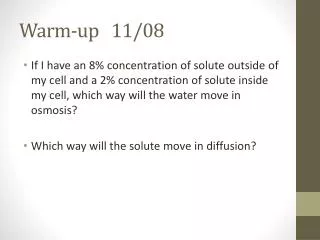
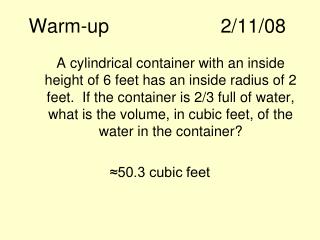
Warm-up 2/11/08 A cylindrical container with an inside height of 6 feet has an inside radius of 2 feet. If the container is 2/3 full of water, what is the volume, in cubic feet, of the water in the container? ≈50.3 cubic feet
Finish Unit 3 Test 20 minutes Work on papers/any make up work?
§1.1: Tables and Graphs LEQ: How do you use samples to make inferences about populations? Refer to the chapter opener on p. 5. Use the information to find the following:
Find the percentage of accidental deaths caused by each of the following methods. • Motor vehicle accidents • Falls • Poisoning • Fires • Drownings • Choking • firearms
Vocabulary • Statistics • Branch of math dealing with collection, organization, analysis, and interpretation of information (data) • Data • Information that is collected • Variable • A characteristic that can be counted, measured, classified, or ordered • Ex) religion, height, weight, race, # siblings
Population • The set of all things you want to study • Sample • A portion of a population that is being studied • A subset of the population • Survey • Process of gathering information through interview or questions • Census • Survey of an entire population • Random • Every member of a population has an equal chance of being selected
Graphs • Bar graphs • Most appropriate when one variable is categorical and another numerical • Circle graphs • Most appropriate when data consists of a sum and its component parts • Remember x/360 = part/whole population
Warm-up 2/12/08 Here are the approximate areas and populations (1995) of the continents of the world. Construct a circle graph of the areas.
Reminder: • Extra Credit projects due Thursday • Send copy of projects to my email: cphippen@lanier.k12.ga.us
Assignment Section 1.1 p.10-11 #5 – 20 Discuss/Do as a class
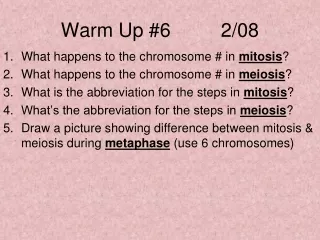
§1.2: Stem plots and Dot plots LEQ: How do you use stem plots to describe data sets and to compare/ contrast data sets? Read p. 13 – 16 (10 minutes) Answer p. 16 #1 – 3 in notes
NOTES… • Stem plots can show data in the order they were recorded or in numerical order (both are ok) • Dots can be used to split large leaves into more manageable groups • Outliers are not just at extremes, but must also be away from the cluster of other values
“Coding” • Data involving decimals or negative numbers can be changed to positive whole numbers by “coding” the data • 1.001, 0.079, 0.167 • Multiply all by 1000 • Negative numbers can be coded by adding a large number to all data values to make them positive
Summary How are stem plots useful for organizing data?
Assignment Section 1.2 p. 16 – 18 #5 – 16, 19
Warm-up 2/13/08 Find the mean and median salary. Why do you suppose workers may be upset that the company reports the “Average Worker Earns $51,000”?
Assignment Section 1.2 p. 16 – 18 #5 – 16, 19
In – Class Activity p. 19 – 20 In books
§1.3: Measures of Center LEQ: How do you compare measures of center? What does it mean? Mean Median Mode
Summation Notation • Sigma • “summation notation” • “sigma-notation” • “Σ-notation” • “the sum of the x-sub-i’s as i goes from a to b” • “I” is the index because it indicates the position of a number.
Measures of Central Tendency • “measures of center” • Usually refers to all three (mean, median, mode); in some cases, may only refer to mean and median • Very low or very high scores may pull a mean up or down, while the median may not change • When finding mean, if there are multiple frequencies, don’t forget to multiply f# of x. • “x-bar”
Calculator operations • Stat utilities • Sort • 1 & 2 – var stats • List utilities • Retrieving lists • “ops” • “math” • Min, max, mean, median, sum, std dev, variance • Residuals
Warm-up 2/14/08 • Find the median of the #’s above the median. • Find the median of the #’s below the median. (same chart from yesterday)
Check homework (1.3 worksheet)
Assignment 1.3 Worksheet (Guided Practice) Section 1.3 p. 25 – 28 #1, 3, 9 – 15, 18 – 21 Read Section 1.4 p. 29 – 33 in textbook Answer p. 34 # 1 – 5
§1.4: Quartiles, Percentiles, Box Plots LEQ: How do you read and interpret box plots? Spread (range) Quartiles Four subsets of the data First quartile (middle of lower #’s) Second quartile (middle – Median) Third Quartile (middle of upper #’s)
More Vocabulary • Interquartile range • Q3 – Q1 (the difference between the largest and smallest quartile) • “five number summary” • Min x, Q1, Med, Q3, Max x • Percentiles • “p” percent of the numbers are less than that value • Ex. Maximum is the 100th percentile
Box Plots • Enter data into stat • 2nd Y= • stat plot on • Select box plot • Lower “whisker” is minimum • Lower box corner is lower quartile • Middle is median • Upper box corner is upper quartile • Upper “whisker” is maximum
Finding outliers • Technical definition of an outlier • Find “interquartile range” (Q3 – Q1) • Q3 + 1.5(IQR) is an upper outlier • Q1 – 1.5(IQR) is a lower outlier • Some statistics utilities will show any outliers as dots beyond the whiskers
Warm-up 2/19/08 • Suppose x1 = 2, x2 = 7, x3 = 4 • Evaluate each expression.
Reminders • Take Home quiz • Retests today and tomorrow after school • Extra credit test this Friday (1st block) over Greek alphabet
1.4 Assignment? Section 1.4 p. 34 – 36 # 6 – 15, 17 - 24
Guided Practice Getting back into the groove: 1.4 Worksheet
§1.5: Histograms LEQ: How do you read and interpret histograms? What is a histogram? Frequency histogram – Organizes data into groups by frequency Relative Frequency histogram – Organizes data into groups by percent values
Drawing a histogram • Organize the data into non-overlapping intervals of EQUAL WIDTH • Count number of observations per interval & record results in a frequency table • Draw the histogram • Mark endpoints of intervals on horizontal axis • Mark frequencies on vertical axis • No space should be between horizontal groups (because histograms often represent continuous variables)
What a histogram tells you • Information about spread • Shows clusters • A skewed histogram has more data to the left or right • Poor choice of intervals can make a histogram difficult to interpret • Histograms can be distorted if intervals are not of equal width • Too few intervals will lump data together
Practice • 1.5 Worksheet • Section 1.5 • P. 43 – 45 • #1, 4 – 8, 13 – 18, 20 - 26
Warm-up 2/20/08 • Mara knows she has an 88 average in her biology class. But she lost one of her papers. The three papers she could find have scores of 98%, 84%, and 90%. What is the score on her fourth paper? • Gabriel earns 87 % on his first geography test. He wants to keep a 92% average. What does he need to get on his next two tests to bring his average up?
Homework? Section 1.5 P. 43 – 45 #1, 4 – 8, 13 – 18, 20 – 26
Reminders • Retests today after school • Sign-up for verbal tests over Greek alphabet on Friday • Another Extra Credit?! • Read 1-8 in book and answer questions 1 – 9 • Turn in date?