Download
1 / 44
460 likes | 669 Vues
Experimental Design and Communicating Scientific Findings. Tyler Bassett and Tomomi Suwa 12.07.2011. Designing A Scientific Study Thoughts on Experimental Design. Two types of studies. 1) Observational 2) Experimental. Observational Study

E N D
Experimental Design and Communicating Scientific Findings Tyler Bassett and Tomomi Suwa 12.07.2011
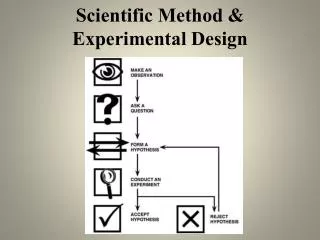
Two types of studies 1) Observational 2) Experimental
Observational Study -Observe subjects and measure variables of interest without directly assigning treatments to the subjects -Less powerful – correlation does not imply causation Reasons for Observational Study: • - Experiment is logistically impossible/impractical: rare species, stars, river • Experiment would violate ethical standards: human disease
Manipulative Experiment • Vary one factor explicitly and keep other factors constant • “Cleaner” than observational study, easier to identify causative agent • When one thinks of “science,” this is what they are thinking of!
Elements of Experimental Design • Independent vs. Dependent variable • Control • Replication • Randomization
Independent vs. Dependent variable Independent Variable – something that is intentionally changed or manipulated by the scientist Dependent Variable – something that might be affected by the change in the independent variable • What is observed and measured
How do elevated soil nutrients affect plant growth ? NO3- Effect of on PO3- NH4+ What is an independent and dependent variable? independent var. dependent var. Also referred to as predictor and response variables
Control • The control and experimental groups must be identical in every way except for the introduction of a suspected causal agent into the experimental group (s). • Compare to an experimental group in a test of a causal hypothesis – often to demonstrate how much the causal agent changes the dependent variable
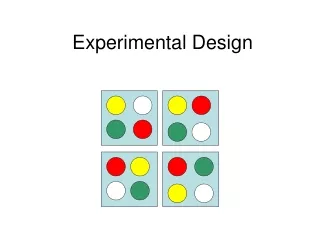
How do elevated soil nutrientsaffect plant growth ? NO3- PO3- NH4+ What is the control here? What does it mean? Control Add N Add P Add N,P
Replication • Repetition of an experiment to test the validity of its conclusion Control Add P Add N,P Add N
Randomization • Assign treatment randomly to an experimental group • Roll dice, random numbers table, Excel: “=rand()” function, www.random.org • Eliminate researchers’ bias or judgment Control Add N Add P Add N,P
Why randomization and replication important? • Reduce/eliminate self-deception and bias. Control Add P Add N,P Add N
Why randomization and replication important? • Biased experimental design Control Add P Add N,P Add N
Graphs Title: The Effect of the independent variable on the dependent variable Dependent Var (unit) Independent Var (unit)
Title: The Effect ofElevated Nutrients on thePlant growth Mean: shows differences between treatment groups. Error Bars: shows variability of data around the mean. • Plant Biomass (g) Why control is important in this case? Control Add N Add P Add N, P Soil Nutrients
Written Communication Oral Communication Visual Communication How do scientists communicate Science? • Research Article • Book • News paper • Website/Blog • Presentation • Meeting • Lecture • Interview (e.g. radio) • Poster • Lecture ppt
Written Communication Oral Communication Visual Communication How do scientists communicate Science? • Research Article • Book • News paper • Website/Blog • Presentation • Meeting • Lecture • Interview (e.g. radio) • Poster • Lecture ppt
In Research Article, Presentation & Poster • Abstract • Introduction • Methods • Results • Conclusions
Let’s have a mini-symposium!(20 min) a) Focal Poster -Presentation -Content b) Rest of the posters Which poster is most catchy/attractive? Why?
Poster Evaluation -Are research questions and hypotheses stated clearly? -Does poster communicate the importance of the study? -What are the dependent and independent variables? -Are the tables and/or figures used to present the data effectively? -Are the conclusions related back to the hypothesis, key scientific concepts, and background research?
Communicating Science: Poster Presentation *Borrowed some materials from: LiLynn Graves Web and Graphic Designer, CCMR
Why poster? • More interactive than writing a paper or giving a talk • More time to talk with people • Can hang on the wall • You can be creative!
What to include? • Title, name • (Abstract) • Background/Intro • Methods • Results • Conclusion • Acknowledgement • (Citation)
What to include • Title – 1-2 lines • Name and affiliations
What to include (cont’d) • Background -Why important/interesting -Hypotheses *Get your audience interested in your work • Methods -Brief -Include photos and illustrate experimental design, if possible
What to include (cont’d) • Results -Include tables, figures, stats and brief description. -Make sure your x and yaxis are labeled clearly. -Keep it simple! Population size of Predator and Prey through Time 500 Prey Predator Population Size 250 0 10 20 Days
What to include (cont’d) • Conclusions - Address your hypotheses - Discuss why your results are interesting/important - “big picture” - future direction • (Literature cited) • Acknowledgement
Title, name • (Abstract) • Background/Intro • Methods • Results • Conclusion • Acknowledgement • (Citation)
Colors Be considerate for people with colour-vision deficiency
Poster in PowerPoint • Determine the size of a poster File -> page setup 46 x 38 inches • Font size no smaller than size 40
After you make a poster draft… • Print out a letter size draft and edit, edit, edit! • Get feedback from your teacher/mentor and peers “Peer Edit”
Peer evaluation? • Get feedback from different people • Good practice to give/receive constructive criticism • Good motivation?