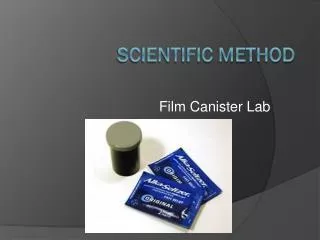
Experimental Design using Scientific Method :
Experimental Design using Scientific Method :. When scientists begin an experiment they use the steps of the Scientific Method . You will be asked to understand many of these steps on the STAAR Test next year. Scientific Method – a logical step by step way of solving problems.

Experimental Design using Scientific Method :
E N D
Presentation Transcript
Experimental Design using Scientific Method: When scientists begin an experiment they use the steps of the Scientific Method. You will be asked to understand many of these steps on the STAAR Test next year.
Scientific Method – a logical step by step way of solving problems
Problem: Will the amount of water given effect plant growth? The Problem(in the form of a question) that the scientists will try to answer, must be logical and based on data or observations.
Problem - what you want to learn or understand
A prediction called a Hypothesis is next. It must be a testablestatement that you could gather data to prove. (You can’t measure which is the “prettiest”, “strongest”, or “best”.) Hypothesis: Less than 500ml per week will slow growth of ivy plants.
Hypothesis – an educated guess to explain what you observe or what might happen Testable – can be proven true or false with data
You must controlan experiment. You can test only one variableat a time. (How does the amount of water effect plant growth? Keep the light, containers, soil and plants the same.) Controls: Light, type of plant, amount of soil, pot, temperature.
Control –what you do not change in an experiment Variable – what changes in an experiment
400ml 500ml 300ml A Control Groupis the set-up that isn’t changed. (One plant gets the normal amount of water!). Which group above is the control group?
The independent variableis the thing you change (amount of water). The dependent variableis the result of the change you made (height of plant in cm.). Independent variable: Amount of water given in ml. Dependent variable: Plant growth in cm.
Independent variable – what I change in an experiment on purpose Dependent variable – what changes because of changing the independent variable
When reporting the results, the Independent Variableis graphed on the X-axis. The Dependent variableis on the Y-axis. DRY MIX = DependentResponding Variable on Y-axis Manipulated Independent Variable on X-axis Growth in mm Amount of Water
The Conclusionmust be supported by the data & results you gather. To be valid, each experiment needs a large sample size(grow 2000 plants in each experiment) and must be repeated many timesin order to prove the Hypothesis (grow 2000 plants 100 times). If you are collecting samples, in an experiment, do it randomly. Don’t take them all from one place. Yes! No!
Conclusion – what you have learned (hypo true?)valid - true, trusted, reliable
Check for understanding Check for understanding by answering the following questions. Remember that you are using the scientific method (scientific reasoning and investigating skills).
Which of these is a hypothesis that can be tested through experimentation? F Bacterial growth increases as temperature increases. G A fish’s ability to taste food is affected by The pH of aquarium water. H Tadpoles’ fear of large insects increases as the tadpoles age. J The number of times a dog wags its tail indicates how happy the dog is.
The correct answer is F. Bacterial growth can be measured. Dog happiness, fish taste, and tadpole fear cannot be measured scientifically.
The table shows times required for water to evaporate from identical containers. Which of these is the bestquestion to ask before developing a reasonablehypothesis to explain the data? A Does a lower temperature slow the rate of evaporation? B What is the boiling point of the water after both samples are heated? C Why does water exist as a solid at -15°C and as a liquid at 25°C? D How does the rate of evaporation change when a different container is used?
The correct answer is A.The table shows data taken to investigate temperature and the evaporation of water.