Geneomics and Database Mining and Genetic Mapping
180 likes | 212 Vues
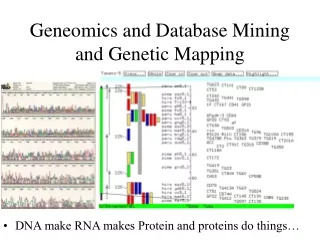
Geneomics and Database Mining and Genetic Mapping. DNA make RNA makes Protein and proteins do things…. Sequence databases change how we “do” biology.

Geneomics and Database Mining and Genetic Mapping
E N D
Presentation Transcript
Geneomics and Database Mining and Genetic Mapping • DNA make RNA makes Protein and proteins do things…
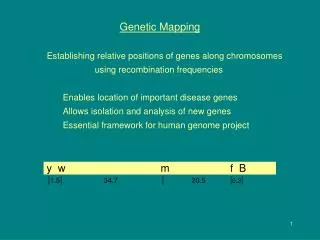
Mapping requires:The ability to measure traitsDifferences that segregate in populationsStatistical and computational techniques to build maps in conventional and unconventional populations
What techniques can we use to measure genetic differences and similarities? RFLPs showing co-dominant inheritance in an F2
PCR-based CAPs, SNPs, SSRs……. • Markers showing expected 7:1 segregation in an inbred backcross populations (BC2S5)
How to “mine” sequence data for: Genetic markers SSRs, SNPs, Conserved motifes How to analyze sequence data using distributed resources Identification of ORFs Identification of probable gene function more….
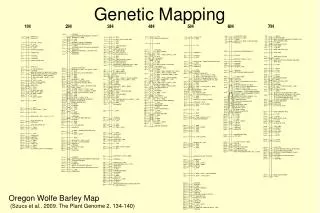
Saturated maps and targeted marker hunts • Many crops and model species have saturated genetic maps • Marker data can be accessed through specialized web sites (e.g. SGN for tomato http://www.sgn.cornell.edu) • map position • trait data (cross specific) • Sequence of selected RFLPs
Detection of SNPs “in silico” Align BLAST two sequences ClustalX
Finding signal through the noise • False positive The rate of PM < error • True SNP
Sequence data opens up possibilities of designing markers in silicofrom conserved regions (e.g. resistance gene analogs).
2-DE of low stringency fractions (soluble protein) Inoculated 2353 Un-inoculated 2353
From protein to gene • From peptide fragments or amino acid sequence to DNA sequence is software driven. • Example: • Expert Protein Analysis System proteomics server of the Swiss Institute of Bioinformatics • Protein Prospector UCSF Mass Spectrometry Facility
Before we use markers in the lab for a mapping exercise…… • Introduction to public data-bases • Basic DNA sequence manipulation (FASTA format, Sequence utilities, ORF finder, BLAST) • Peptide Sequence searching • Exercise (first hand experience)
http://www.oardc.ohio-state.edu/tomato francis.77@osu.edu