What is Cluster Analysis?
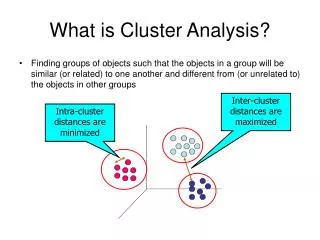
Inter-cluster distances are maximized. Intra-cluster distances are minimized. What is Cluster Analysis?. Finding groups of objects such that the objects in a group will be similar (or related) to one another and different from (or unrelated to) the objects in other groups.

What is Cluster Analysis?
E N D
Presentation Transcript
Inter-cluster distances are maximized Intra-cluster distances are minimized What is Cluster Analysis? • Finding groups of objects such that the objects in a group will be similar (or related) to one another and different from (or unrelated to) the objects in other groups
Applications of Cluster Analysis • Understanding • Group related documents for browsing, group genes and proteins that have similar functionality, or group stocks with similar price fluctuations • Summarization • Reduce the size of large data sets Clustering precipitation in Australia
What is not Cluster Analysis? • Supervised classification • Have class label information • Simple segmentation • Dividing students into different registration groups alphabetically, by last name • Results of a query • Groupings are a result of an external specification
How many clusters? Six Clusters Two Clusters Four Clusters Notion of a cluster can be ambiguous
Types of Clusterings • A clustering is a set of clusters • Important distinction between hierarchical and partitionalsets of clusters • Partitional Clustering • A division data objects into non-overlapping subsets (clusters) such that each data object is in exactly one subset • Hierarchical clustering • A set of nested clusters organized as a hierarchical tree
A Partitional Clustering Partitional Clustering Original Points
Hierarchical Clustering Dendrogram
Other Distinctions Between Sets of Clusters • Exclusive versus non-exclusive • In non-exclusive clusterings, points may belong to multiple clusters. • Can represent multiple classes or ‘border’ points • Fuzzy versus non-fuzzy • In fuzzy clustering, a point belongs to every cluster with some weight between 0 and 1 • Weights must sum to 1 • Probabilistic clustering has similar characteristics • Partial versus complete • In some cases, we only want to cluster some of the data • Heterogeneous versus homogeneous • Cluster of widely different sizes, shapes, and densities
Types of Clusters • Well-separated clusters • Center-based clusters • Contiguous clusters • Density-based clusters • Described by an Objective Function
Types of Clusters: Well-Separated • Well-Separated Clusters: • A cluster is a set of points such that any point in a cluster is closer (or more similar) to every other point in the cluster than to any point not in the cluster. 3 well-separated clusters
Types of Clusters: Center-Based • Center-based • A cluster is a set of objects such that an object in a cluster is closer (more similar) to the “center” of a cluster, than to the center of any other cluster • The center of a cluster is often a centroid, the average of all the points in the cluster, or a medoid, the most “representative” point of a cluster 4 center-based clusters
Types of Clusters: Contiguity-Based • Contiguous Cluster (Nearest neighbor or Transitive) • A cluster is a set of points such that a point in a cluster is closer (or more similar) to one or more other points in the cluster than to any point not in the cluster. 8 contiguous clusters
Types of Clusters: Density-Based • Density-based • A cluster is a dense region of points, which is separated by low-density regions, from other regions of high density. • Used when the clusters are irregular or intertwined, and when noise and outliers are present. 6 density-based clusters
Types of Clusters: Objective Function • Clusters Defined by an Objective Function • Finds clusters that minimize or maximize an objective function.
Characteristics of the Input Data Are Important • Type of proximity or density measure • This is a derived measure, but central to clustering • Sparseness • Dictates type of similarity • Adds to efficiency • Attribute type • Dictates type of similarity • Type of Data • Dictates type of similarity • Dimensionality • Noise and Outliers • Type of Distribution
Clustering Algorithms • K-means and its variants • Hierarchical clustering • Density-based clustering
K-means Clustering • Partitional clustering approach • Each cluster is associated with a centroid (center point) • Each point is assigned to the cluster with the closest centroid • Number of clusters, K, must be specified • The basic algorithm is very simple
K-means Clustering – Details • Initial centroids are often chosen randomly. • Clusters produced vary from one run to another. • The centroid is (typically) the mean of the points in the cluster. • ‘Closeness’ is measured by Euclidean distance, cosine similarity, correlation, etc. • K-means will converge for common similarity measures mentioned above. • Most of the convergence happens in the first few iterations. • Often the stopping condition is changed to ‘Until relatively few points change clusters’ • Complexity is O( n * K * I * d ) • n = number of points, K = number of clusters, I = number of iterations, d = number of attributes
K-means clustering in JMP • Analyze – Multivariate Methods – Cluster • Options: check Kmeans (instead of hierarchical) • Select Columns – OK • Go • Iterative Clustering Options
Evaluating K-means Clusters • Most common measure is Sum of Squared Error (SSE) • For each point, the error is the distance to the nearest cluster • To get SSE, we square these errors and sum them. • x is a data point in cluster Ci and mi is the representative point for cluster Ci • can show that micorresponds to the center (mean) of the cluster • Given two clusterings, we can choose the one with the smallest error • One easy way to reduce SSE is to increase K, the number of clusters
Evaluating K-means Clusters • Need to incorporate measure of separation between clusters, not only similarity inside each cluster • Dissimilarity ratio = (inter-cluster distance / intra-cluster distance) • Computing dissimilarity ratio from JMP output
Computing dissimilarity ratio from JMP output: • Centroid coordinates are given in the output. However each value has to be normalized. • Obtain mean and standard deviation of each dimension to compute normalized coordinates of centroids. These can be obtained from Histograms. • Distances between centroids X and Y are given by • The inter-cluster distance will be the smallest of the distances between centroids. • The intra-cluster distance is the mean distance (obtained from JMP histogram) • Compute ratio • Dissimilarity ratio = (inter-cluster distance / intra-cluster distance)
Optimal Clustering Sub-optimal Clustering Two different K-means Clusterings Original Points
Problems with Selecting Initial Points • If there are K ‘real’ clusters then the chance of selecting one centroid from each cluster is small. • Chance is relatively small when K is large • If clusters are the same size, n, then • For example, if K = 10, then probability = 10!/1010 = 0.00036 • Sometimes the initial centroids will readjust themselves in ‘right’ way, and sometimes they don’t • Consider an example of five pairs of clusters
10 Clusters Example Starting with two initial centroids in one cluster of each pair of clusters
10 Clusters Example Starting with two initial centroids in one cluster of each pair of clusters
10 Clusters Example Starting with some pairs of clusters having three initial centroids, while other have only one.
10 Clusters Example Starting with some pairs of clusters having three initial centroids, while other have only one.
Solutions to Initial Centroids Problem • Multiple runs • Helps, but probability is not on your side • Sample and use hierarchical clustering to determine initial centroids • Select more than k initial centroids and then select among these initial centroids • Select most widely separated • Postprocessing
Pre-processing and Post-processing • Pre-processing • Normalize the data • Eliminate outliers • Post-processing • Eliminate small clusters that may represent outliers • Split ‘loose’ clusters, i.e., clusters with relatively high SSE • Merge clusters that are ‘close’ and that have relatively low SSE
Limitations of K-means • K-means has problems when clusters are of differing • Sizes • Densities • Non-globular shapes • K-means has problems when the data contains outliers.
Limitations of K-means: Differing Sizes K-means (3 Clusters) Original Points
Limitations of K-means: Differing Density K-means (3 Clusters) Original Points
Limitations of K-means: Non-globular Shapes Original Points K-means (2 Clusters)
Overcoming K-means Limitations Original Points K-means Clusters • One solution is to use many clusters. • Find parts of clusters, but need to put together.
Overcoming K-means Limitations Original Points K-means Clusters
Overcoming K-means Limitations Original Points K-means Clusters