March 17, 2003 ESRC Research Methods Programme Workshop on Modelling and Simulations
330 likes | 464 Vues
March 17, 2003 ESRC Research Methods Programme Workshop on Modelling and Simulations Fine-Scale Models of Urban Movement Michael Batty & Paul Longley m.batty@ucl.ac.uk p.longley@geog.ucl.ac.uk http://www.casa.ucl.ac.uk/. Outline of the Talk

March 17, 2003 ESRC Research Methods Programme Workshop on Modelling and Simulations
E N D
Presentation Transcript
March 17, 2003 ESRC Research Methods Programme Workshop on Modelling and Simulations Fine-Scale Models of Urban Movement Michael Batty & Paul Longley m.batty@ucl.ac.ukp.longley@geog.ucl.ac.uk http://www.casa.ucl.ac.uk/
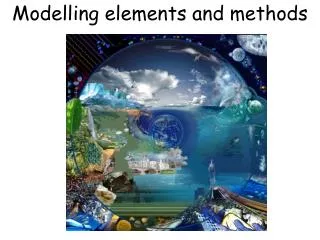
Outline of the Talk • Agent-Based Approaches: Mobility and Random Walks • The Generic Model(s) • Preliminary Work: Models of Crowding – Buildings, Centres: Panic, Evacuation, Safety • Fine-Scale Data: Geometry, Demographics, Movement • An Example: Our Notting Hill Carnival Project • The Model I: Flocking and Crowding: Swarms • The Model II: Multi-Stage Simulations – The Impact of Control and Policy • Next Steps: Discussion
1. Agents – Behavior – Randomness – Geometry Nigel Gilbert has talked about multi-agent models so we will not deal with these further except to say that our focus is on agent-based spatial models, at the scale of geometry as well as geography and they are intrinsically dynamic The concept of the agent is most useful when it is mobile, dynamic; this suggests that problems of movement where we can identify agents unambiguously are good candidates for such simulation Agents have behaviour: not simply a product of intentions – it is as much a product of uncertainty, hence randomness and physics, geometry. This is what makes it attractive.
Defining Agents – objects that have motion Agents in this talk (and these models) are mainly people, literally individuals, but sometimes other objects such as physical objects like streets and barriers and plots of land can be treated as agents –often a matter of convenience. Agents as people can have different kinds of behaviour from the routine to the strategic. It is our contention that agent-based models are much better at simulating the routine A very simple characterisation of these models is that they are based on random movement in the first instance, then we add geometry, then we add intentions – utility
2. The Generic Model(s) Essentially our model of walking in small scale environments like streets is a product of three things – the avoidance of obstacles with some preliminary notions of vision in the agents, the idea of directional intention – where walkers want to go to, and very local random movement like a first order random walk We also have two other key components in the model – the idea of capacities or congestion which leads to dispersion, and the idea of attraction which leads to flocking. Movement is a product of all these factors arranged to be processed sequentially but in parallel for each agent
The way we add some socio-economic logic to the random walk is through assuming that the walkers are moving to some specific destination – which we will encode into the spatial environment on which the walkers are moving. This is important because we encode the attraction into the cells on which walkers move – in fact geometry and vision is also encoded into cells – agents do not have individual protocols – for reasons of simplification at this stage We will introduce a source of walkers and move them towards the destination with the walkers climbing a regular gradient surface to the destination. We will add various degrees of randomness to these walks and then constrain the geometry
Here are some of examples. Rather than write out the equations (which are in papers on our web site), we will run some movies to show what happens We start with a street, launch walkers and then narrow the street to see the effect of crowding This is a street junction in Notting Hill where the parade – grey walkers – are surrounded by those watching the parade in red with them breaking through the parade in panic
Narrow Street – no obstacles Street with Obstacles A Parade with Crowds pressing in an Panic
3. Models of Crowding – Buildings and Town Centres: Panic, Evacuation, Safety There are several different approaches– flow/diffusion models, spatial interaction, queuing, scheduling etc. We have worked mainly with flow models all with intention based on where people want to go, encoded into the spatial cells on which they walk. We have geometry to which walkers react in term of obstacle avoidance. We have randomness for any direction of walking –but constrained so that there is exploration to enable new directions to be chosen. We have diffusion for dispersing congestion and flocking for copying others.
A Second Attempt: A Town Centre: Movements from car parks and stations into the centre of the English town of Wolverhampton population ~ 250 000 We have also developed a SWARM model of this problem – there is a paper in Environment and Planning B by Haklay, O’Sullivan et al.
4. Fine-Scale Data: Geometry, Demographics, Movement: Problems Geometry is easiest – OS etc, RS data, photogrammetric techniques Demographics – Protocols as to why people want to move, why they are attracted to different points in the space, how we can break up them up into different types of agent with different behaviours, how they react to each other ? – more psychological than economic ? Movement – track data almost impossible – how do we observe this – a digression to show how some of this data is being collected
5. The Notting Hill Carnival Project: Our Major Example How to solve problems of packing many people into small spaces and not letting them crush each other to death, and developing a quality environment which minimises crime. We will look at the nature of the problem and then at the data needed to observe and understand the problem – this is an issue in its own right as it is complicated by lack of preference data and data on how people flock & disperse and track to the event itself, as we have just noted This was a project for the GLA over a 9 month period
a.What is the Notting Hill Carnival A Two day Annual event based on a street parade and street concerts in inner London, a celebration of West Indian ethnic culture. Started in 1964; attracting 150,000 people by 1974. It attracts up to 1 million visitors and spreads over an area of about 3.5 sq miles
b. The Project: Public Safety We have been involved in the problem of redesigning the route location for the parade which is judged to be ‘unsafe’ because of crowding • 710,000 visitors in 2001. • continuous parade along a circular route of nearly 5 kms 90 floats and 60 support vehicles move from noon until dusk each day • 40 static sound systems • 250 street stalls selling food. • peak crowds occur on the second day between 4 and 5 pm • 260,000 visitors in the area. • 500 accidents, • 100 requiring hospital treatment • 30 percent related to wounding • 430 crimes committed over the two days • 130 arrests • 3500 police and stewards each day.
c. Observing the Carnival: Data • We have used 4 different methods to determine the number of people at carnival 2001 • Intelligent Space Flow Survey : 38 streets, 80 people days • Intelligent Space Crowd Density Survey : 1022 digital images, creating a composite image of carnival 2001 • LUL Tube Exit and Entrance Survey • St Johns Ambulance Accident data
Source Sunday Monday Total ISP survey 172,344 366,636 538,980 Extrapolated Counts 39,217 48,222 87,439 Westbourne Park Tube 13,726 25,810 39,536 Residents 44,353 44,353 44,353 Total 269,600 485,000 710,300 Visitors to Carnival 2001
Road Name % of Total Flows In % of Total Flows Out 1. Kensington Park Road 19% 14% 2. Westbourne Grove (East) 15% 10% 3. Ladbroke Grove (North) 10% 13% 4. Great Western Road 9% 12% Sum Routes 1-4 54% 49% Access to Carnival is very unevenly distributed 3 4 2 1
6. The Model I: Flocking and Crowding: Swarms • We need to simulate how visitors to the carnival move from their entry points to the events that comprise the carnival – the locations of the bands and the line of the parade • The problem is complicated by • We do not know the actual (shortest) routes linking entry points to destinations • 2. Detailed control of the event by the police etc. is intrinsic to the event – we need to introduce this control slowly to assess its effect
We define agents as walker/visitors (W) who move, the bands that can be moved (B), the paraders who move in a restricted sense (P), and the streets (S) that can be closed
We run the model in three stages, slowly introducing more control to reduce congestion • We first find the shortest routes from the ultimate destinations of the walkers to their entry points using a “SWARM” algorithm – this is our attraction surface • This gives us the way walkers move to the carnival and in the second stage we simulate this and assess congestion • We then reduce this congestion by closing streets etc and rerunning the model, repeating this stage, until a “safe” situation emerges
The First Stage: Computing the Attraction-Access Surface We compute the access surface using the concept of swarm intelligence which essentially enables us to let agents search the space between origins and destinations to provide shortest routes, and these determine the access surface. This is an increasingly popular method of finding routes in networks and it is based on the idea that if you launch enough agents and let them wander randomly through the network, they will find the objects in question
Let’s do this for the real street geometry and run the movie to see how this happens
6. The Model II: Multi-Stage Simulations – The Impact of Control In essence, once we have generated the access and shortest route surfaces, we use these or a combination of these – a linear/weighted combination – as the final surface and we then pass to a second stage. We use a regression model to estimate entry point volumes and then let these walkers out at the entry points and then let them establish their steady state around the carnival – thus we run the model again We generate a new density surface and this then enables us to pass to a third stage
Let us run the Second Stage Unconstrained Simulation Movie
In the third stage, we figure out where the crowding is worst and then introduce simple controls – close streets etc In fact in the existing simulation we already have several streets and subway stations controlled and we can test these alternatively. Thus in the existing simulation, we can figure out if the existing controls are optimal We then engage in detailed crowd analysis e.g.
To show where We are let us show the flow chart again
8. Discussion ? • Resources on these Kinds of Model • http://www.casa.ucl.ac.uk/ • http://www.geosimulation.com/ • http://www.csis.u-tokyo.ac.jp/english_2002/ • http://www.casa.ucl.ac.uk/~david/ • http://www.casa.ucl.ac.uk/ijgis/ • http://www.nature.com/nsu/020819/020819-8.htmlhttp://www.envplan.com/