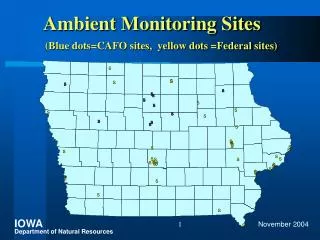
Model domain and surface sites (AIRNOW, AIRMAP)
220 likes | 391 Vues
Comparison of three photochemical mechanisms (CB4, CB05, SAPRC99) for the Eta-CMAQ air quality forecast model for O 3 during the 2004 ICARTT study Shaocai Yu $,& , Golam Sarwar + , Rohit Mathur + , Daiwen Kang $,& , Daniel Tong $,& , & Atmospheric Modeling Division, ARL, NOAA , RTP, NC 27711.

Model domain and surface sites (AIRNOW, AIRMAP)
E N D
Presentation Transcript
Comparison of three photochemical mechanisms (CB4, CB05, SAPRC99) for the Eta-CMAQ air quality forecast model for O3 during the 2004 ICARTT study Shaocai Yu$,&, Golam Sarwar+,Rohit Mathur+, Daiwen Kang$,&, Daniel Tong$,&, &Atmospheric Modeling Division, ARL, NOAA, RTP, NC 27711. $On assignment from Science and Technology Corporation, + NERL, U.S. EPA, RTP, NC 27711
CB05 and SAPRC: more species and reactions; better characterization of radical recycling; but need more time
Model domain and surface sites (AIRNOW, AIRMAP) AIRMAP sites
P-3: Northeast; • DC-8: Eastern US P-3 DC-8 Tracks of (a) P-3, (b) DC-8
Results: Max 8-hr O3 at AIRNOW sites • Very close
Results: O3 Vertical profiles (7/14-8/15) Daily Layer Means Height (m) (1) P-3 • Models reproduced vertical structure of Obs • P3: SAPRC99>CB05>CB4>Obs • DC-8: similar to P3 although slightly close to Obs
Results: CO and HNO3 Vertical profiles (7/14-8/15) Daily Layer Means • CO: • Consistent Underpredictions. • partly due to inadequate representation of biomass burning effects from outside the domain • Obs>CB05~CB4>SAPRC Height (m) (1) P-3 Conc. (ppb) • HNO3: • Very good • Slight underprediction Conc. (ppb)
Results: NO2 and NO Vertical profiles (7/14-8/15) Daily Layer Means • NO2: • P3: good at high altitudes • Underestimate at lower altitudes • Organic nitrate can react back to NO2 in CB05 and SAPRC • NO: • Under predictions of NO • Aircraft and lightning NO emissions are not in inventory
Results: NOy, SO2, H2O2Vertical profiles (7/14-8/15) Daily Layer Means • NOy, • Consistent overestimation SO2: • Overestimation at low altitudes but good at high altitudes • H2O2: • CB4: significant overestimation • Its H2O2 formation rate is 62% higher than CB05 (Luecken et al., 2008) • CB05 and SAPRC: close to Obs • CB05: slightly higher than Obs • SAPRC: slightly lower than Obs • CB05 produces more new HO2, enhancing H2O2
Results:Time-series evaluationon ship O3 • Gas species (NMB ,%) O3+NO2 CO NOy NO2 NO PAN Slightly better: • CB4: O3, CO, NO2, NO, SO2 • CB05: Isop • SAPRC: NOy, PAN SO2 Isoprene
Results:Time-series dataon ship O3 production efficiency (eN) • O3-NOz slope (Olszyna et al., 1994): • Upper limit of eN • SAPRC>CB05>CB4 but all are lower than Obs • Consistent with O3 concentrations
Results2.Time-series evaluation at AIRMAP sites O3 CO High O3 period (721-7/23) NO Low O3 period (724-7/27) NO2 NOy SO2 Castle Springs (CS)
Results2.O3 production efficiency at AIRMAP sites (O3-NOz slope)
Results2.O3 production efficiency at AIRMAP sites (O3-NOz slope) eN • O3-NOz slope: • Upper limit of eN • SAPRC>CB05>CB4 but all are lower than Obs • Consistent with O3 concentrations • SAPRC is close to Obs
Contacts: Brian K. Eder email: eder@hpcc.epa.gov www.arl.noaa.gov/ www.epa.gov/asmdnerl
Contacts: Brian K. Eder email: eder@hpcc.epa.gov www.arl.noaa.gov/ www.epa.gov/asmdnerl
CBMIV (Operational) vs. CB05(experimental) performanceMax 8-hr O3, CONUS, June 15-Aug. 31, 2008 • Lower bias and error with CB05 at moderate-high O3 mixing ratios • Higher error in regional statistics due to over-prediction at low mixing ratio range • - Could it be for reasons other than chemical mechanism?
Results • July 16-22, 2004: Evidence of effects of long range transport (Alaskan fire) (1) MODIS (satellite) observations for AOD (2) TOMS (satellite) observations for absorbing aerosol index 7/19/04 7/17/04 7/18/04 • Significant underpredictions of PM2.5 by the model during July 16 to 26 are mainly due to inadequate representation of biomass burning (carbonaceous aerosol) effects from outside the domain (Alaskan fire)