Process Layout
Process Layout. Chapter 8. D. D. L. L. M. M. D. D. L. L. M. M. L. L. M. M. G. G. L. L. G. G. A. A. A. A. G. G. How Process Layout fits the Operations Management Philosophy . Operations As a Competitive Weapon Operations Strategy Project Management.

Process Layout
E N D
Presentation Transcript
Process Layout Chapter 8 D D L L M M D D L L M M L L M M G G L L G G A A A A G G
How Process Layout fits the Operations Management Philosophy Operations As a Competitive Weapon Operations Strategy Project Management Process Strategy Process Analysis Process Performance and Quality Constraint Management Process Layout Lean Systems Supply Chain Strategy Location Inventory Management Forecasting Sales and Operations Planning Resource Planning Scheduling
Layout Planning • Layout planning is planning that involves decisions about the physical arrangement of economic activity centers needed by a facility’s various processes. • Layout plans translate the broader decisions about the competitive priorities, process strategy, quality, and capacity of its processes into actual physical arrangements. • Economic activity center: Anything that consumes space -- a person or a group of people, a customer reception area, a teller window, a machine, a workstation, a department, an aisle, or a storage room.
Layout Planning Questions Before a manager can make decisions regarding physical arrangement, four questions must be addressed. • What centers should the layout include? • How much space and capacity does each center need? • How should each center’s space be configured? • Where should each center be located?
Location Dimensions • The location of a center has two dimensions: • Relative location: The placement of a center relative to other centers. • Absolute location: The particular space that the center occupies within the facility.
Original layout Frozen Meats foods Dry groceries Vegetables Bread Revised layout Frozen Meats foods Dry groceries Vegetables Bread Absolute Locations vs. Relative Locations Four of the absolute locations have changed but not the relative locations.
Strategic Issues • Layout choices can help communicate an organization’s product plans and competitive priorities. • Altering a layout can affect an organization and how well it meets its competitive priorities in the following ways: • Increasing customer satisfaction and sales at a retail store. • Facilitating the flow of materials and information. • Increasing the efficient utilization of labor and equipment. • Reducing hazards to workers. • Improving employee morale. • Improving communication.
Performance Criteria • Customer satisfaction • Level of capital investment • Requirements for materials handling • Ease of stockpicking • Work environment and “atmosphere” • Ease of equipment maintenance • Employee and internal customer attitudes • Amount of flexibility needed • Customer convenience and levels of sales
Types of Layouts • Flexible-flow layout: A layout that organizes resources (employees) and equipment by function rather than by service or product. • Line-flow layout: A layout in which workstations or departments are arranged in a linear path. • Hybrid layout: An arrangement in which some portions of the facility have a flexible-flow and others have a line-flow layout. • Fixed-position layout: An arrangement in which service or manufacturing site is fixed in place; employees along with their equipment, come to the site to do their work.
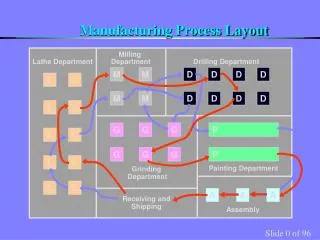
Grinding Forging Lathes Painting Welding Drills Milling Office Foundry machines A Flexible Flow Layout A job shop has a flexible-flow layout.
Flexible-Flow layout (funktionell verkstad) • Fördelar med en funktionell verkstad: • flexibel, anpassningsbar till varierande produktionsförhållande, lätt att styra om produktionen till att tillverka nya produkter • låg störningskänslighet, om en maskin går sönder kan man arbeta i en annan • genom specialisering erhålls personal med specialistkunnande • högt maskinutnyttjande kan åstadkommas
Nackdelar med en funktionell verkstad: • hög kapitalbindning, mycket produkter i arbete och stora mellanlager • långa osäkra genomloppstider • svåra planerings, lednings och administrationsproblem • ofta långa transportvägar • genom specialisering, kan den enskilde operatören bli låst till sin maskin
Station 1 Station 2 Station 3 Station 4 Line Flow Layout A production line has a line-flow layout.
Line-Flow layout (linjetillverkning) • Fördelar med linjetillverkning: • kort genomloppstid • mindre kapitalbindning • mindre transporter • arbetet lättare att planera och administrera än i en funktionell verkstad (när installationen är klar)
Nackdelar med linjetillverkning:Icke flexibel, produktionsupplägg och maskiner anpassas till att tillverka en speciell produkt vid en viss given efterfråganStörningskänslighet, ett maskinhaveri stoppar all produktion av produktenKan i vissa fall leda till ensidiga arbetsuppgifter
Creating Hybrid Layouts • Layout flexibility is the property of a facility to remain desirable after significant changes occur or to be easily and inexpensively adopted in response to changes. • AOne-worker, multiple-machines (OWMM) cell is a one-person cell in which a worker operates several different machines simultaneously to achieve a line flow. • A Cell is two or more dissimilar workstations located close together through which a limited number of parts or models are processed with line flows.
Group Technology (GT) • Group Technology (GT) is an option for achieving line-flow layouts with low-volume processes; this technique creates cells not limited to just one worker and has a unique way of selecting work to be done by the cell. • The GT method groups parts or products with similar characteristics into families and sets aside groups of machines for their production.
Lathing Milling Drilling D D L L M M D D L L M M Grinding L L M M G G Assembly L L G G A A Receiving and shipping A A G G Jumbled flows in a job shop without GT cells Before Group Technology
M L L G Assembly area D A A Cell 2 Cell 1 L M Receiving G G Cell 3 M L D Shipping Line flows in a job shop with three GT cells Applied Group Technology
Designing Flexible-Flow Layouts • Step 1: Gather information • Space requirements by center • Available space • Closeness factors: which centers need to be located close to one another. • Closeness matrix: A table that gives a measure of the relative importance of each pair of centers being located close together. • Step 2: Develop a Block plan: A plan that allocates space and indicates placement of each department. • Step 3: Design a detailed layout.
Space Requirements Current Block Plan Department Area Needed (ft2) 1. Administration 3,500 2. Social services 2,600 3. Institutions 2,400 4. Accounting 1,600 5. Education 1,500 6. Internal audit 3,400 Total 15,000 3 6 4 100' 1 2 5 150' Gather Information Example 8.1 Office of Budget Management
3 6 4 100' 1 2 5 150' Trips between Departments Department 1 2 3 4 5 6 1. Administration — 2. Social services — 3. Institutions — 4. Accounting — 5. Education — 6. Internal audit — 3 6 5 6 10 8 1 1 3 9 2 1 Departments 3 and 5 have the next highest. Departments 2 and 3 have next priority. Closeness Matrix Example 8.1 Office of Budget Management Departments 1 and 6 have the most interaction.
3 6 4 100' 1 2 5 150' First put departments 1 and 6 close together Next put departments 3 and 5 close together Then put departments 2 and 3 close together 2 3 6 100' 5 1 150' Proposed Block Plan 4
Applying the Weighted- Distance Method • Weighted-distance method: A mathematical model used to evaluate flexible-flow layouts based on proximity factors. • Euclidean distance is the straight-line distance, or shortest possible path, between two points. • Rectilinear distance: The distance between two points with a series of 90 degree turns, as along city blocks.
Euclidian Distance dAB= (xA– xB)2 + (yA – yB)2 Rectilinear Distance dAB= |xA– xB| + |yA – yB| Distance Measures
Calculating the WD Score © 2007 Pearson Education Example 8.2 Load Distance Analysis Current PlanProposed Plan Dept Closeness DistanceDistance Pair Factor, w dwd Scoredwd Score 1,2 3 1326 1,3 6 16318 1,4 5 31515 1,5 6 212212 1,6 10 220110 2,3 8 21618 2,4 1 2211 2,5 1 1122 3,4 3 2626 3,5 9 32719 4,5 2 1212 5,6 1 2233 ld = 112ld = 82
Other Decision Support Tools • Automated layout design program (ALDEP): A computer software package that constructs a good layout from scratch, adding one department at a time. • Computerized relative allocation of facilities technique (CRAFT): A heuristic method that begins with the closeness matrix and an initial block layout, and makes a series of paired exchanges of departments to find a better block plan.
Storage area 3 5 5 6 4 2 7 1 5 5 4 4 2 7 Dock Aisle Storage area Warehouse LayoutsOut-and-back Pattern • The most basic warehouse layout is the out-and-back pattern. The numbers indicate storage areas for same or similar items.
Zones Zones Control station Click to add title Shipping doors Tractor trailer Tractor trailer Feeder lines Feeder lines Overflow Warehouse LayoutsZone System
Office Layouts • Most formal procedures for designing office layouts try to maximize the proximity of workers whose jobs require frequent interaction. • Privacy is another key factor in office design. • Four common office layouts: • Traditional layouts • Office landscaping (cubicles/movable partitions) • Activity settings • Electronic cottages (Telecommuting)
Designing Line-Flow Layouts • Line balancing is the assignment of work to stations in a line so as to achieve the desired output rate with the smallest number of workstations. • Work elements are the smallest units of work that can be performed independently. • Immediate predecessors are work elements that must be done before the next element can begin. • Precedence diagram allows one to visualize immediate predecessors better; work elements are denoted by circles, with the time required to perform the work shown below each circle.
Line BalancingExample 8.3 Green Grass, Inc., a manufacturer of lawn & garden equipment, is designing an assembly line to produce a new fertilizer spreader, the Big Broadcaster. Using the following information, construct a precedence diagram for the Big Broadcaster.
Work Time Immediate Element Description (sec) Predecessor(s) A Bolt leg frame to hopper 40 None B Insert impeller shaft 30 A C Attach axle 50 A D Attach agitator 40 B E Attach drive wheel 6 B F Attach free wheel 25 C G Mount lower post 15 C H Attach controls 20 D, E I Mount nameplate 18 F, G Total 244 D H 40 B 20 30 E 6 A F 40 C 25 50 I 18 G 15 © 2007 Pearson Education Line BalancingGreen Grass, Inc.
1 r • Cycle time, c is the maximum time allowed for work on a unit at each station: c = Desired Output and Cycle Time • Desired output rate, r must be matched to the staffing or production plan.
Theoretical Minimum Theoretical minimum (TM ) is a benchmark or goal for the smallest number of stations possible, where total time required to assemble each unit (the sum of all work-element standard times) is divided by the cycle time. It must be rounded up Idle time is the total unproductive time for all stations in the assembly of each unit. Efficiency (%) is the ratio of productive time to total time. Balance Delay is the amount by which efficiency falls short of 100%.
1 r • Cycle time, c= 1/60 = 1 minute/unit = 60 seconds/unit Output Rate and Cycle TimeExample 8.4 Green Grass, Inc. • Desired output rate, r= 2400/week Plant operates 40 hours/week r = 2400/40 = 60 units/hour
Calculations for Example 8.4continued Theoretical minimum (TM ) - sum of all work-element standard times divided by the cycle time. TM = 244 seconds/60 seconds = 4.067 It must be rounded up to 5 stations Cycle time: c = 1/60 = 1 minute/unit = 60 seconds/unit Efficiency (%) - ratio of productive time to total time. Efficiency = [244/5(60)]100 = 81.3% Balance Delay - amount by which efficiency falls short of 100%. (100 − 81.3) = 18.7%
D H 40 B 20 30 E 6 A Cumm Idle Station Candidate Choice Time Time F 40 C 25 S1 A A 40 20 S2 B,C C 50 10 S3 B,F,G B 30 30 E,F,G F 55 5 50 I 18 G 15 Big Broadcaster Line Balancing c = 60 seconds/unit TM = 5 stations Efficiency = 81.3% S1 S3 S2
Green Grass, Inc. Line Balancing Solution D H 40 B 20 30 E S1 S3 6 S4 A S2 S5 F 40 C 25 50 I 18 G 15 © 2007 Pearson Education The goal is to cluster the work elements into 5 workstations so that the number of work-stations is minimized, and the cycle time of 60 seconds is not violated. Here we use the trial-and-error method to find a solution, although commercial software packages are also available. c = 60 seconds/unit TM = 5 stations Efficiency = 81.3%
Other Considerations In addition to balancing a line, managers must also consider four other options: 1.Pacing: The movement of product from one station to the next as soon as the cycle time has elapsed. 2. Behavioral factors of workers. 3. Number of models produced: A mixed-model line produces several items belonging to the same family. 4. Cycle times depend on the desired output rate, and efficiency varies considerably with the cycle time selected.
Tiderna för att utföra monteringsoperationerna är enl. följande: M1, Delmontering D1, D2 och D3: 12 min M2, Delmontering D4 och D5: 20 min M3, Delmontering A och B: 10 min M4, Delmontering D6 och D7: 8 min M5, Delmontering D8 och D9: 16 min M6, Delmontering C och D: 22 min M7, Slutmontering E och F: 16 min a) Åskådliggör de olika stegen i monteringen enligt strukturen i ett precedensdiagram (nätverk). Kalla monteringsaktiviteterna M1, M2, ..., M7. b) Minimera antalet monteringsstationer om cykeltiden tillåts vara högst 28 min. Använd "längsta operationstid först" c) Bestäm balanseringsförlusten.